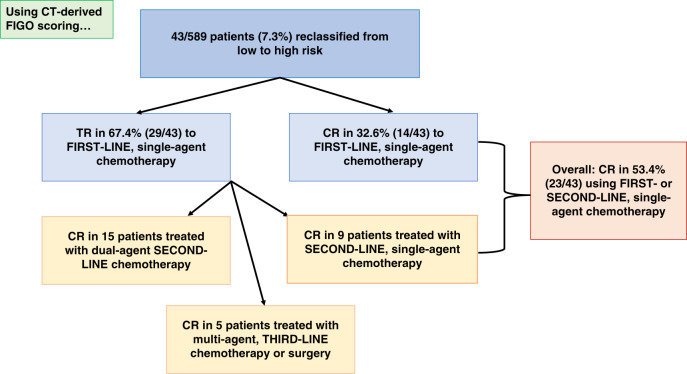
Fig. 2. Flow diagram of the treatment outcomes for the 43 patients who changed from low- to high-risk using CT-based pulmonary imaging. All patients ultimately had a CR and survived.
CT computerised tomography (chest), TR resistance to single-agent chemotherapy, CR complete response to single-agent chemotherapy.

