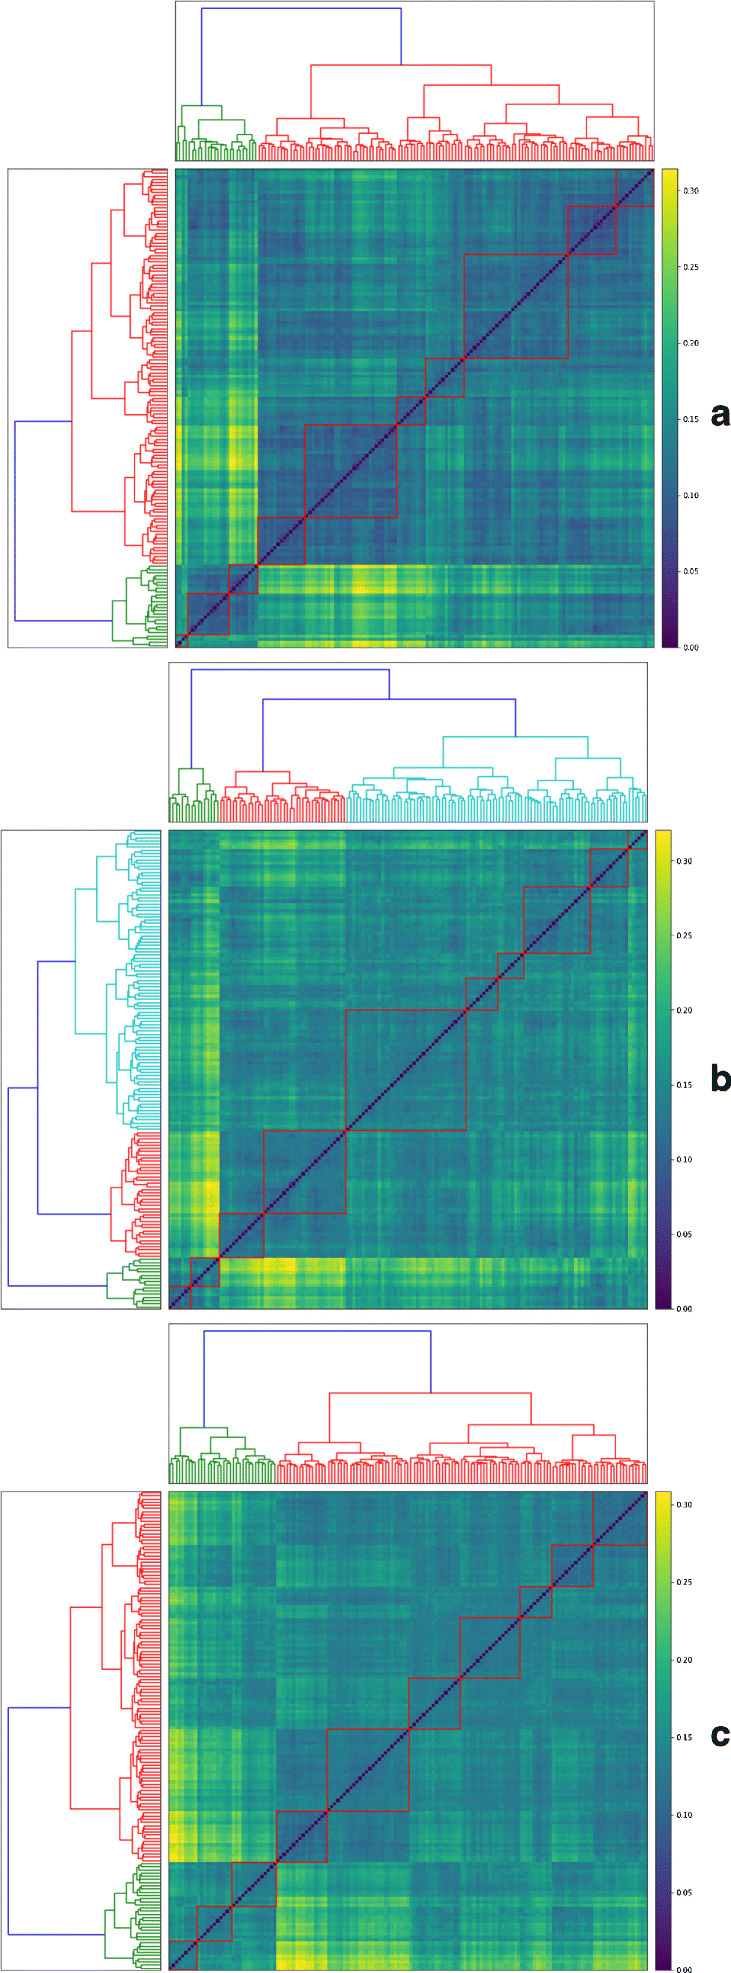
Figure 1.

The dendrograms show 3 hierarchical clusterings of cities aHC1 (N, M, t), b HC2 (N, ΔM, t), and c HC3 (N, , t) using Ward’s linkage. Based on visual inspection of the seriated distance matrix, 10 clusters were identified in each case, as shown on the heatmaps
