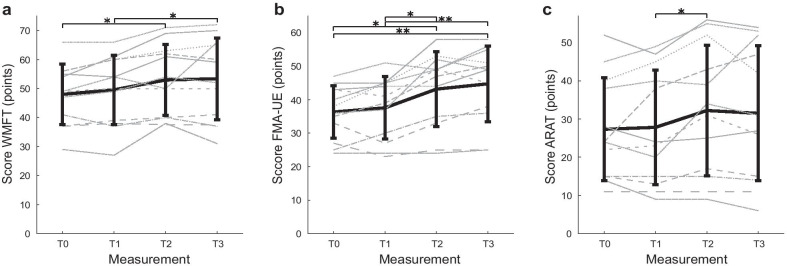
Fig. 3.
Mean score on arm function measurements over time for the primary outcome Wolf Motor Function (a) and secondary outcomes Fugl-Meyer Assessment-Upper Extremity and Action Research Arm Test (b and c). ARAT Action Research Arm Test, FMA-UE Fugl-Meyer Assessment-Upper Extremity, WMFT Wolf Motor Function Test. T0 = baseline, T1 = 6 weeks after baseline, pre-intervention, T2 = post-intervention, T3 = 6 weeks after intervention. * = p < 0.008, ** = p < 0.001. Thick black line = mean; grey striped/dotted lines: individual data. Vertical bars represent standard deviation, N = 12

