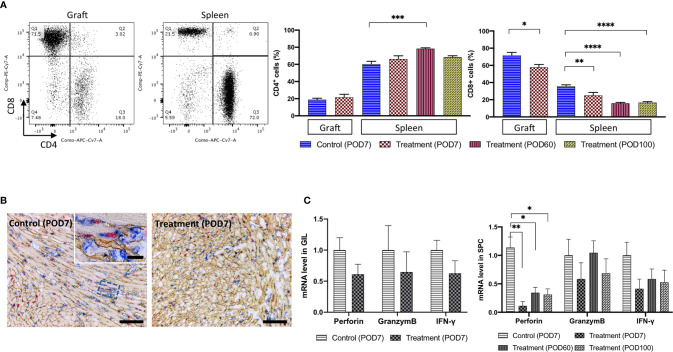
Figure 2.
The number of CD8+ CTLs and the related mRNA expression were decreased in the GILs and in the SPCs of the FR70-treated recipients. GILs and spleens from isotype control-treated (Allo) and FR70-treated (FR70) groups were collected on POD7 [Control (POD7), Treatment (POD7)]. In addition, spleens from the FR70-treated groups were collected at POD60 and 100 [Treatment (POD60), Treatment (POD100)]. GILs and SPCs were separated and stained with anti-CD4 and CD8 mAb. Samples were subjected to FCM. (A) A representative FCM analysis of the CD4 and CD8 in GILs and SPCs is shown (left panel). Gating strategy is shown in Supplementary Figures 2A , B . Quantification of the CD4 and CD8 in GILs and SPCs by FCM is shown (right panel) (Grafts: n = 4 mice/control group; n = 6 mice/FR70-treated group; Spleens: n = 5 mice/allo group; n = 6 mice/FR70-treated POD7 group; n = 8 mice/FR70-treated POD100 group, mean ± SEM, pooled from three independent experiments). Statistical analysis was determined by Student’s t-test, one-way ANOVA and Tukey’s test. *p < 0.05, **p < 0.01, ***p < 0.001, ****p < 0.0001. (B) FR70-treated and control allografts were harvested on POD7 and stained with anti-CD8 (blue), collagen IV (yellowish-brown), and BrdU (red) by triple immunostaining (scale bars: 200 µm). (C) Quantitative RT-PCR of mRNA in GILs collected on POD7 from the FR70-treated and control groups (n = 4–5 mice/group) and SPCs collected on POD7 from the control group and on POD7, 60 and 100 from the FR70-treated group (n = 5 mice/group). The mean ± SEM are presented, pooled from three independent experiments with three biological replicates. Statistical analysis was determined by Student’s t-test, one-way ANOVA, and Tukey’s test. *p < 0.05, **p < 0.01.

