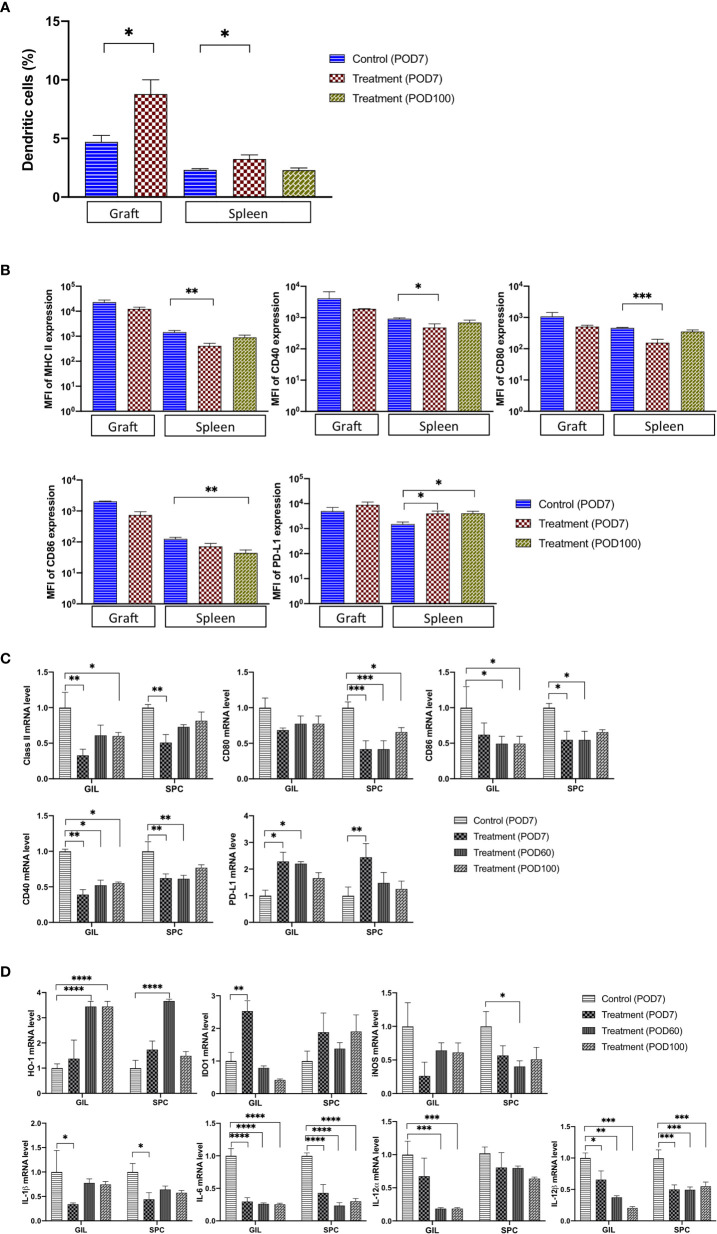
Figure 3.
The number of TolDC and the related mRNA expression were significantly changed in graft and spleen of the FR70-treated recipients. (A) GILs were collected from control (Allo) and FR70-treated groups on POD7, and spleens were harvested from the control group (Allo) on POD7 and the FR70-treated group on POD7 and 100 for FCM. Gating strategy is shown in Supplementary Figure 3A (n = 3–5 mice/group, mean ± SEM, pooled from two independent experiments). Statistical analysis was determined by Student’s t-test, one-way ANOVA, and Tukey’s test. *p < 0.05, **p < 0.01, ***p < 0.001. (B) The median fluorescence intensity (MFI) in CD11c and CD11b double-positive cells in graft and spleen was estimated for cells stained with anti-CD40, CD80, CD86, IA/IE, or PD-L1 antibodies and detected by FCM (Grafts: n = 2 mice/control group; n = 3 mice/FR70-treated group; Spleens: n = 4 mice for isotype control group; n = 5 mice/FR70-treated group POD7 and POD100, mean ± SEM, pooled from two independent experiments). Statistical analysis was determined by Student’s t-test, one-way ANOVA, and Tukey’s test. *p < 0.05, **p < 0.01, ***p < 0.001. (C, D) Grafts and spleens were collected from the control and FR70-treated groups on POD7. In addition, GILs and SPCs from the FR70-treated groups were collected at POD60 and 100. The mRNA expression was quantified by quantitative RT-PCR (Grafts: n = 4 mice/control group; n = 4 mice/FR70-treated POD7 group; n = 5 mice/FR70-treated POD60 group; n = 5 mice/FR70-treated POD100 group; Spleens: n = 4 mice/isotype control group; n = 5 mice/FR70-treated POD7, 60 and 100 groups, mean ± SEM, pooled from two independent experiments with three biological replicates). Statistical analysis was determined by one-way ANOVA and Tukey’s test. *p < 0.05, **p < 0.01, ***p < 0.001, ****p < 0.0001.

