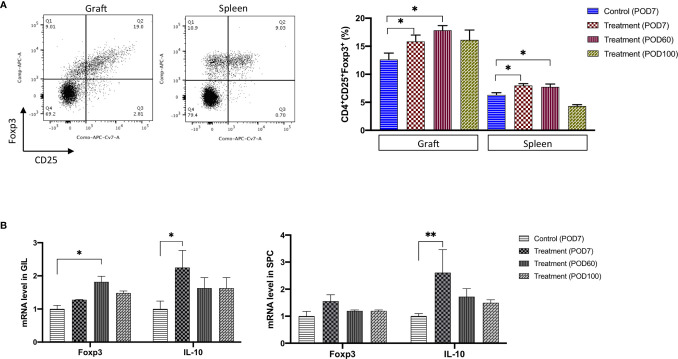
Figure 4.
The Treg cell number and the related mRNA expression were significantly increased in graft and spleen of the FR70-treated recipients. (A) Grafts and spleens were collected on POD7, 60 and 100. The representative data from Foxp3 and CD25 staining with specific antibodies are presented (left panel). The percentage of CD25+ Foxp3+ cells among the CD4+ GILs and SPCs was determined by FCM (right panel, n = 4–8 mice for each group, mean ± SEM, pooled from two independent experiments). Gating strategy is presented in Supplementary Figure 3B . Statistical analysis was determined by one-way ANOVA and Tukey’s test. *p < 0.05. (B) Quantitative RT-PCR of the Foxp3 and IL-10 mRNA levels in GILs and SPCs collected at POD7, 60 and 100 (n = 4–5 mice for each group, mean ± SEM, pooled from three independent experiments with three biological replicates). Statistical analysis was determined by one-way ANOVA and Tukey’s test. *p < 0.05, **p < 0.01.

