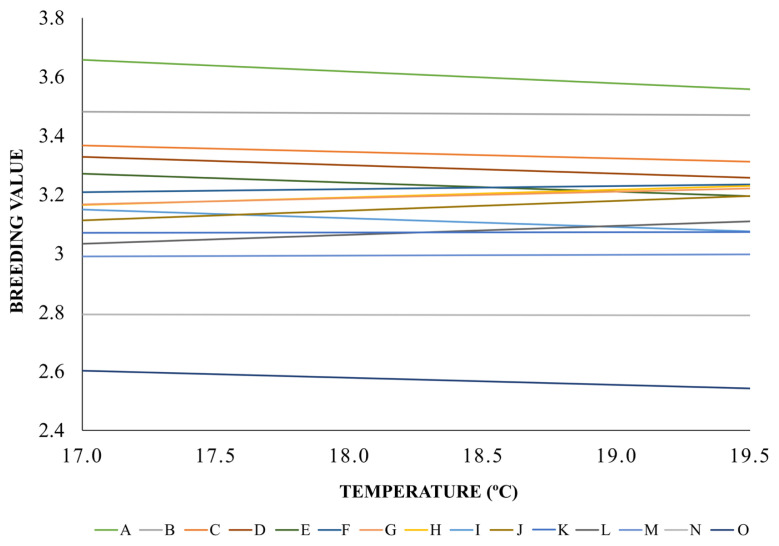
Figure 3.
Reaction norms for somatic cell score of the 15 most representative bulls used in southern Brazil region. The x-axis denotes the temperature gradient (°C), and the y-axis represents the breeding value. It was observed an increase of up to 0.258 in the breeding values of the bulls, as well as a reduction in the breeding value of up to 0.793.

