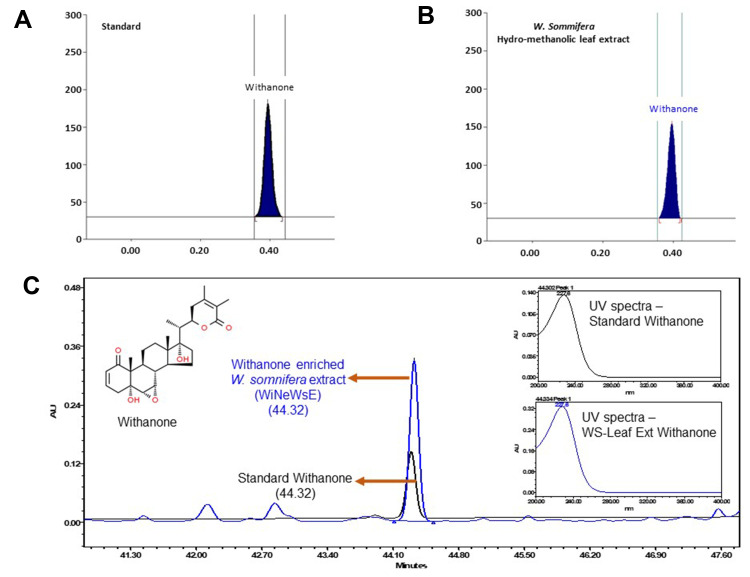
Figure 5.
Compositional analysis of extract prepared from leaves of W. somnifera.
Notes: (A and B) HPTLC spectra of withanone and W. somnifera hydro-methanolic leaf extract both showing peaks at 230 nm. (C) Overlap chromatograms of standard mix (in black) and hydro-methanolic extract of W. somnifera leaves (in blue) showing the peak for withanone eluted at 227 nm. Insets show the individual peaks of standard withanone and that present in W. somnifera leaf extracts.

