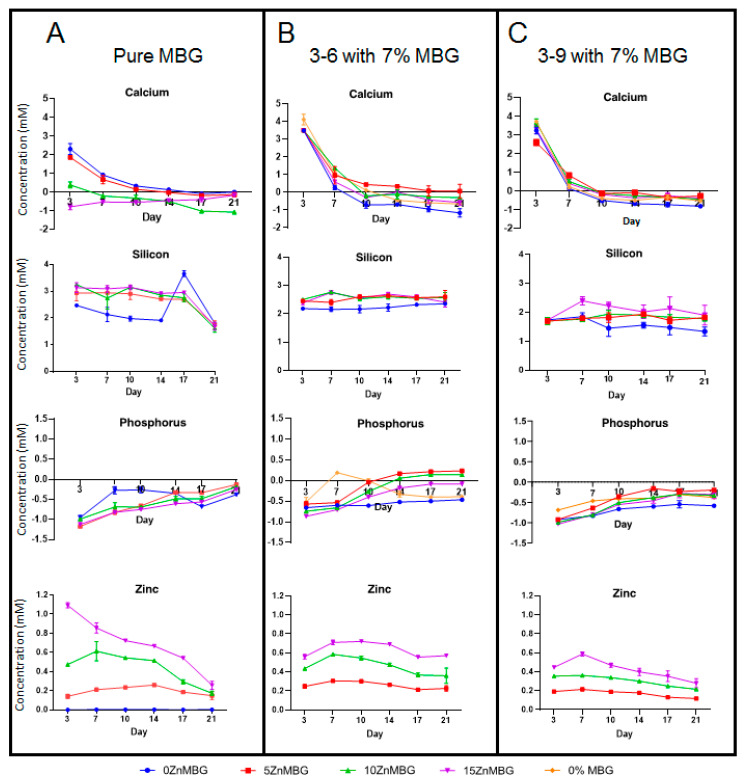
Figure 8.
Release of different ions (A) from bulk MBG and (B) from cell-laden 3–6 and (C) 3–9 composite scaffolds containing 7% of each ZnMBG during 21 days; since no Zn was released from 0ZnMBG (blue line) and from 0% MBG (orange line) samples (data not shown), these values are not presented in (B,C). Values for released concentrations of Si from 0% MBG are not presented in (B,C) for the same reason. Values are means ± SD n = 3.

