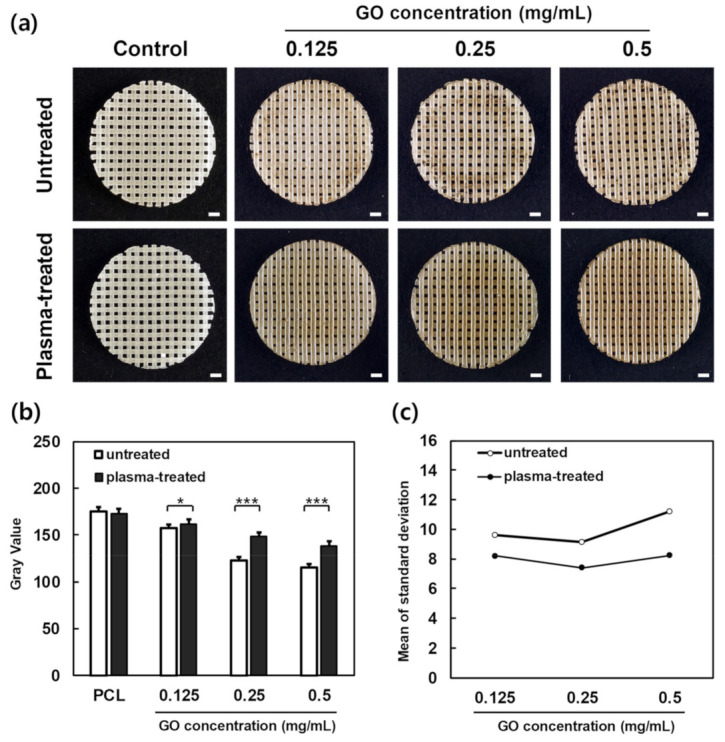
Figure 3.

Image analysis of the scaffolds. (a) Images of PCL, PCL-GO at 0.125 mg/mL, PCL-GO at 0.25 mg/mL, PCL-GO at 0.5 mg/mL, PCL-plasma, PCL-plasma-GO at 0.125 mg/mL, PCL-plasma-GO at 0.25 mg/mL, and PCL-plasma-GO at 0.5 mg/mL scaffolds. Scale bars; 1.0 mm. (b) Pixel intensity by GO density (error bars indicate standard deviations, n = 5). (c) Mean of the standard deviation of pixel intensity by GO density (error bars indicate standard deviations, n = 5). * indicates a significant difference (p < 0.05), *** indicates a significant difference (p < 0.001).
