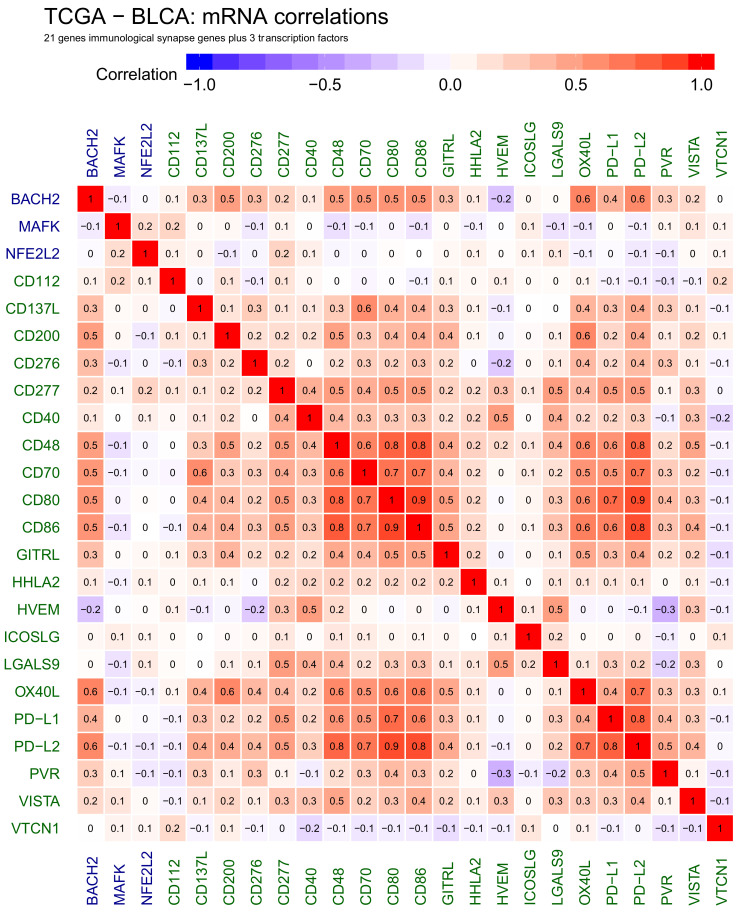
Figure 3.
Heatmap showing correlations between selected genes active at cancer side of the immunological synapse: CD112, CD137L, CD200, CD276, CD277, CD40, CD48, CD70, CD80, CD86, GITRL, HHLA2, HVEM, ICOSLG, LGALS9, OX40L, PD−L1, PD−L2, PVR, VISTA and VTCN1, transcription factors: BACH2, MAFK and NFE2L2. Positive correlations are shown in red, negative correlations are shown in blue. The numbers in heatmap tiles represent the correlation coefficients.

