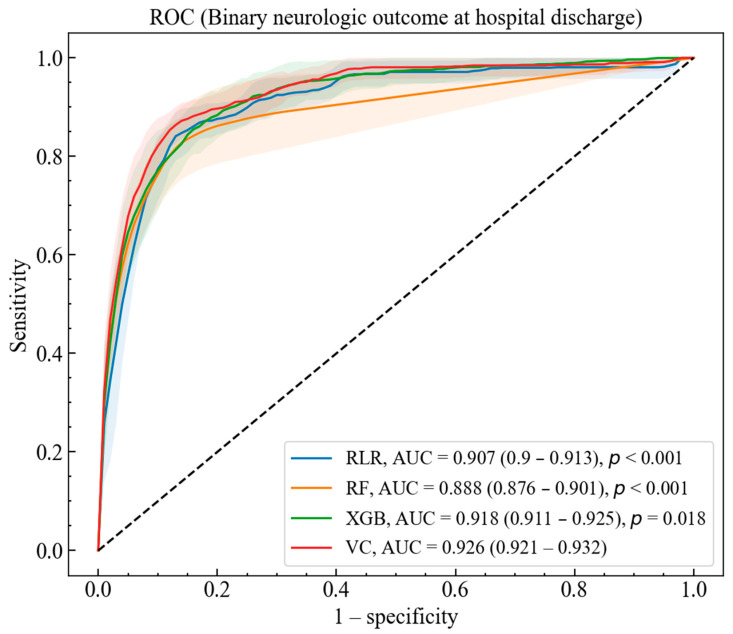
Figure 1.
Receiver Operating Characteristic (ROC) and area under the curves (AUC) of regularized logistic regression (RLR), random forest (RF), extreme gradient boosting (XGB), and voting classifier (VC) for binary neurological outcome at hospital discharge. The colors of the curves and shaded regions represent the mean ROC and standard deviation of each model, respectively. The AUCs of the models and their 95% confidence intervals (CIs) are shown in the legend. The p-values for the hypothesis tests of the differences between the VC and the other models are also indicated in the legend.

