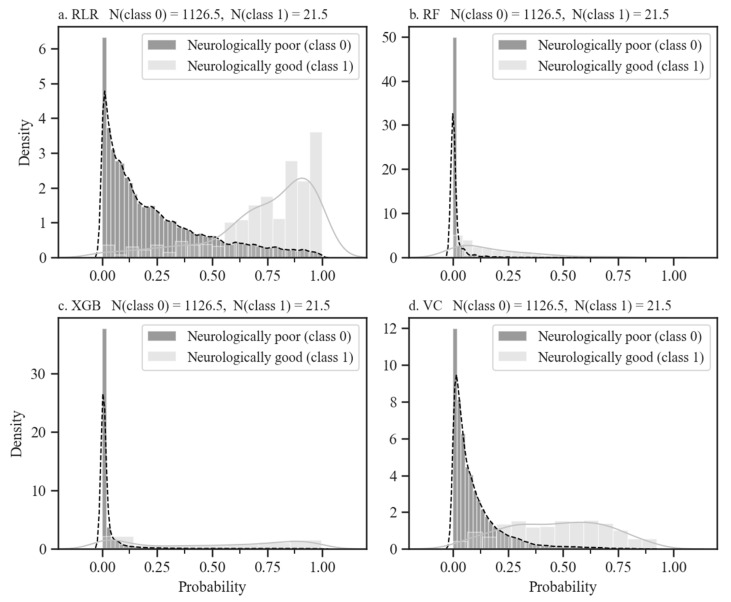
Figure 3.
Probability histogram and kernel density estimation of neurological outcomes for four ML models. The title of the panels is the ML model name and the average number of samples per class of test sets. The probability histograms and kernel density estimations for good neurological outcomes are shown in silver bars and solid lines respectively, while those for poor neurological outcomes are represented as black bars and dashed lines, respectively. The panels of (a–d) are the probability distributions of the test sets by RLR, RF, XGB, and VC models, respectively.

