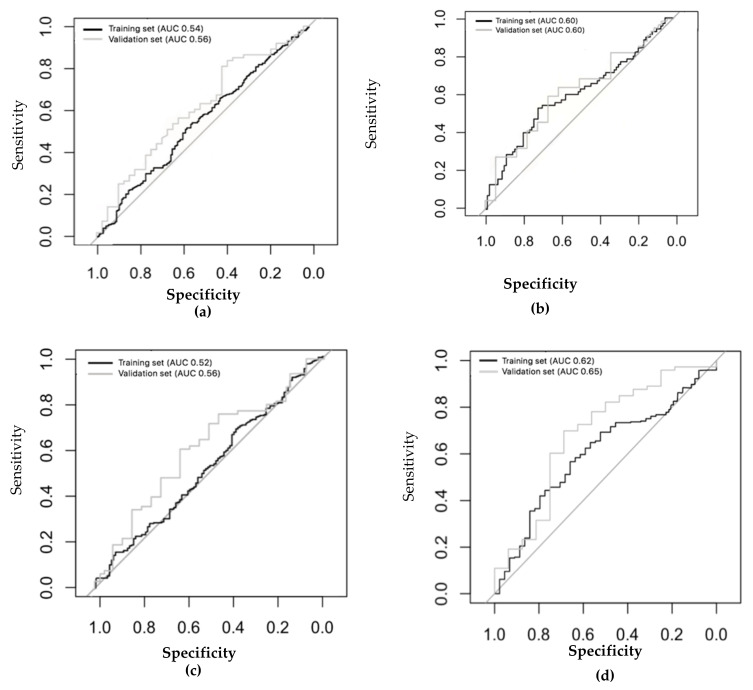
Figure 3.
ROC analyses showing the accuracy of the linear discriminant model based on principal component reduction in the training set and the independent validation set for the healthy control group. (a) Ever-smokers in healthy subjects: training set (n = 452) AUC: 0.54 (95% CI: 0.49–0.60); validation set (n = 113) AUC: 0.60 (95% CI: 0.50–0.69). (b) Time of last cigarette consumption in healthy subjects (control: more than 24h; case: less than 24h) training set (n = 160) AUC: 0.60 (95% CI: 0.50–0.69); validation set (n = 39) AUC: 0.60 (95% CI: 0.42–0.70). (c) Ex- (n = 139) and never-smokers (n = 366): training set (ex-smokers = 116; never-smokers = 292), AUC: 0.52 (95% CI: 0.46–0.58); validation set (ex-smokers = 23; never-smokers = 74) AUC: 0.56 (95% CI: 0.46–0.60). (d) Active (n = 60) and never smokers (n = 366): training set (active smokers = 44; never-smokers = 292) AUC: 0.62 (95% CI: 0.51–0.67); validation set (active smokers = 16; never smokers = 74) AUC: 0.65 (95% CI: 0.53–0.71).

