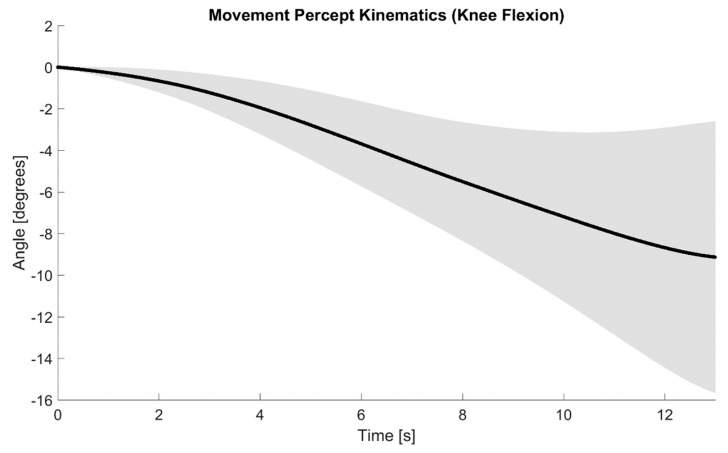
Figure 5.
The experienced movement percepts of the participant, as demonstrated by the participant’s intact limb and captured via motion capture. The negative joint angle values (y-axis, in degrees) indicate knee flexion. Only 13 s are shown for the x-axis since the participant did not experience a change in illusion beyond that time frame. The black line is the average of the 16 successful trials, whereas the shaded area depicts the variation across trials (±1 standard deviation band). Note that the maximum standard deviation, within the terminal phase was approximately 6.5 degrees. The participant’s movement percepts can be generally described as an inverted sigmoidal curve.

