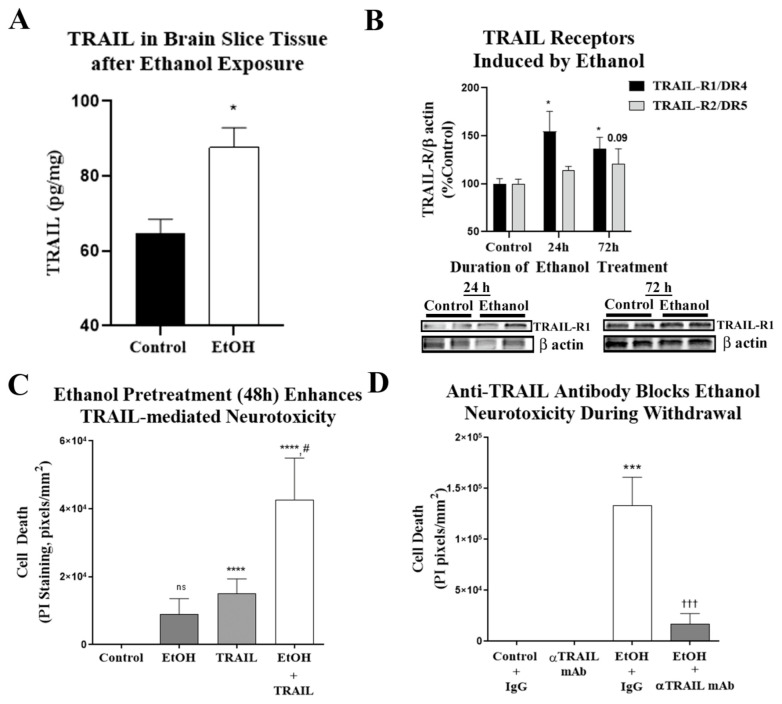
Figure 8.
Ethanol-induced neurodegeneration in primary organotypic brain slice culture involves TRAIL. (A) Organotypic brain slice cultures (OBSCs) were treated with ethanol (100 mM) for 4 days. TRAIL was measured by ELISA 16 h into withdrawal prior to onset of neuronal cell death. Ethanol caused a 36% increase in TRAIL in slice tissue. n = 9 control, 3 ethanol slices. (B) OBSCs were treated with ethanol (100 mM) for 24–72 h. TRAIL-R1/DR4 and TRAIL R2/DR5 were measured by Western blot. Ethanol caused a 1.55-fold increase in TRAIL-R1 protein levels at 24 h and a 1.66-fold increase at 72 h (* p < 0.05). Ethanol caused a trend toward a 1.2-fold increase in TRAIL-R2 protein levels at 72 h (p = 0.09, n = 9 control and 3 ethanol). Images of blots at 72 h of EtOH treatment are shown. (C,D) The ability of ethanol pretreatment to enhance TRAIL neurotoxicity was assessed. OBSCs were treated with ethanol for 48 h, which was followed by addition of recombinant TRAIL (0.75 µg/mL) for 24 h. Neurodegeneration was assessed by propidium iodide (PI) uptake. (C) Ethanol and TRAIL alone caused a moderate amount of neurodegeneration. However, ethanol pretreatment caused a robust, synergistic enhancement in neurodegeneration due to TRAIL. ANOVA: F3.34 = 7.2, p = 0.0007. *** p < 0.001 vs. control, # p < 0.05 vs. TRAIL alone, Sidak’s multiple comparisons test. n = 9–10 slices/group (D) Representative image showing enhancement of TRAIL neurodegeneration by ethanol pretreatment. (E) The role of TRAIL in ethanol-induced neurodegeneration was assessed using the TRAIL monoclonal antibody (αTRAIL mAb). OBSC was treated with ethanol (100 mM) for 72 h followed by ethanol withdrawal (EW) for 24 h ± rat αTRAIL mAb (0.5 µg/mL) or rat immunoglobulin G (IgG) isotype control. EW caused significant neurodegeneration, which was completely abolished by αTRAIL mAb. ANOVA: F4.42 = 9.3, p < 0.0001. **** p < 0.0001 vs. IgG alone control, ††† p < 0.001 vs. EW + IgG, Sidak’s multiple comparisons test. n = 7–16 slices per group. (F) Representative images showing inhibition of EW-induced neurodegeneration by αTRAIL mAb. Fluorescent PI images were converted to black and white images for ease of visualization.

