Table 3.
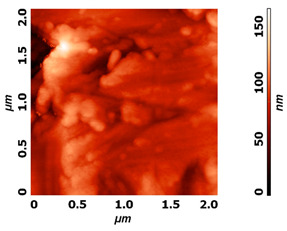
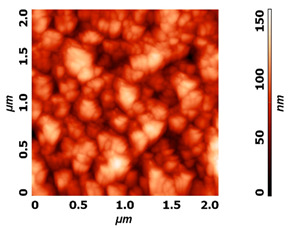
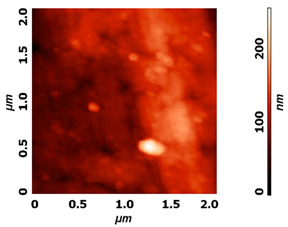
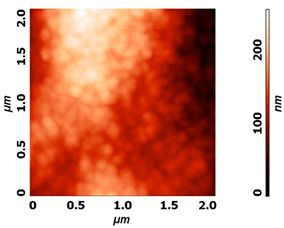
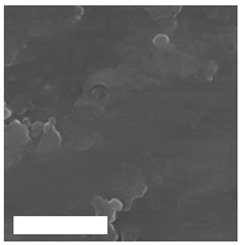
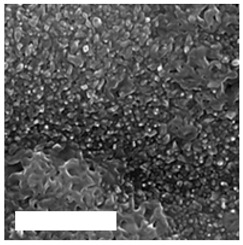
Nanostructures obtained on plasma-treated samples compared to the untreated ones. The white bar on SEM images represents 1 µm.
| Untreated | Plasma Treated | |
|---|---|---|
| Ti6Al4V (AFM) |
|
|
| NiTi (AFM) |
|
|
| Ti (SEM) |
|
|
Nanostructures obtained on plasma-treated samples compared to the untreated ones. The white bar on SEM images represents 1 µm.
| Untreated | Plasma Treated | |
|---|---|---|
| Ti6Al4V (AFM) |

|

|
| NiTi (AFM) |

|

|
| Ti (SEM) |

|

|