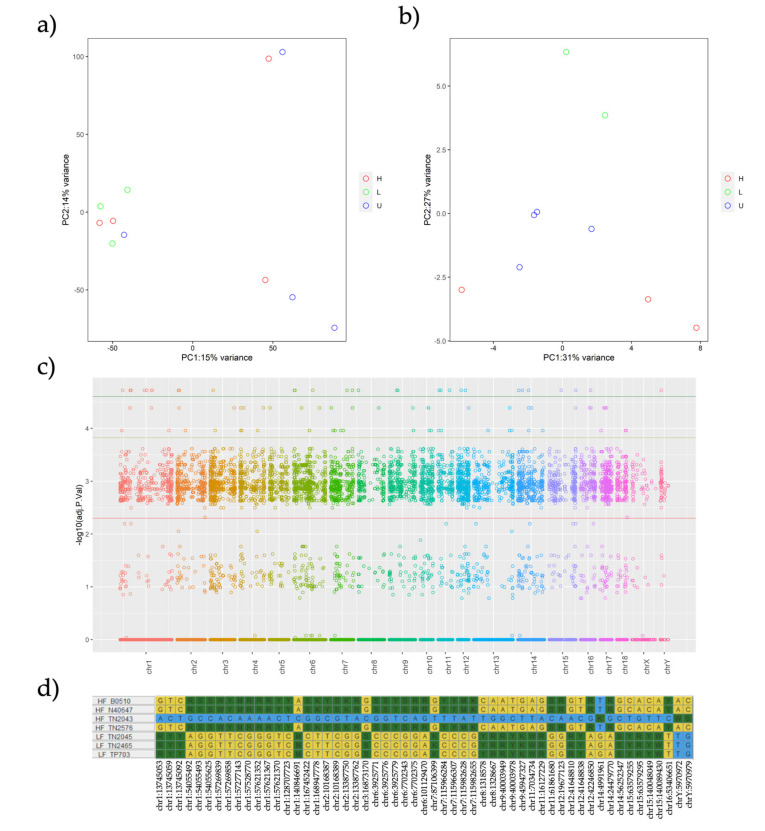
Figure 1.
(a–d). Principal Component Analysis (PCA) across 11 individual boars from High Fertile (HF), Low Fertile (LF), and Unknown Fertility (UF) experimental groups depicting in (a) all 42,963 Single Nucleotide Polymorphisms (SNPs) and in (b) the significant 169 SNPs; (c) is a Manhattan plot of all the analyzed SNPs with the green threshold separating the TOP SNPs from the others. Finally, (d) lists the loci frequency of these TOP SNPs among all the analyzed boars.

