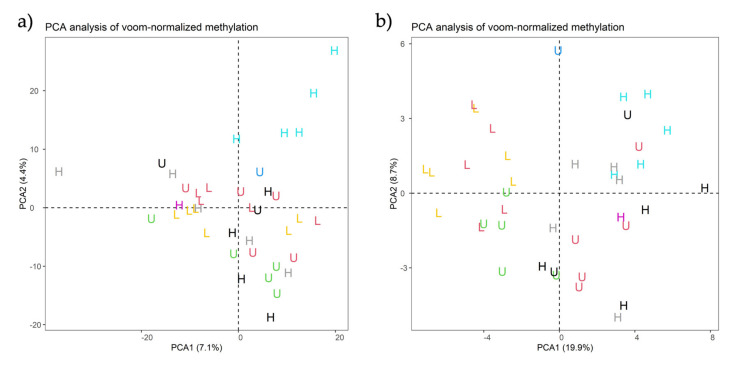
Figure 2.
(a,b). Principal component analysis (PCA) of (a) all 1209 regions of interest (ROIs) and (b) the 46 significant Differentially Methylated Regions (DMRs) across 39 samples from HF (n = 15), LF (n = 11), and UF (n = 13) experimental groups represented by the letters H, L, and U, respectively.

