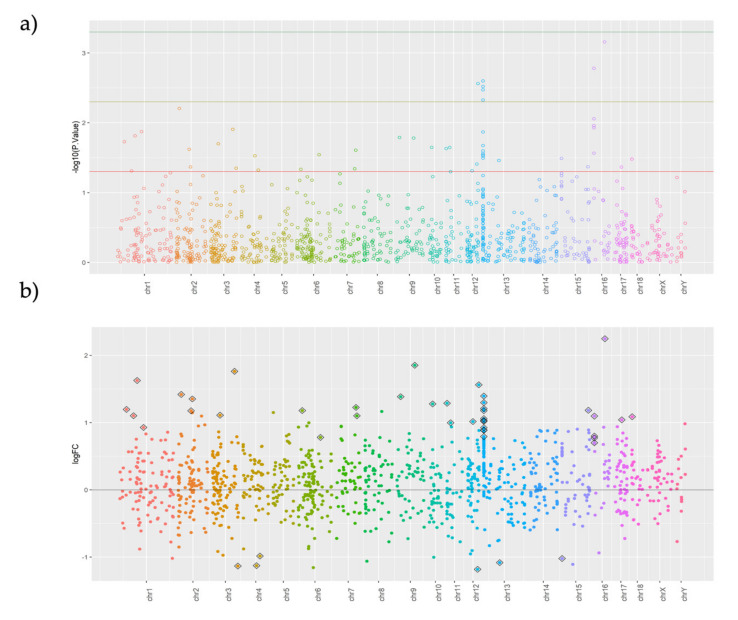
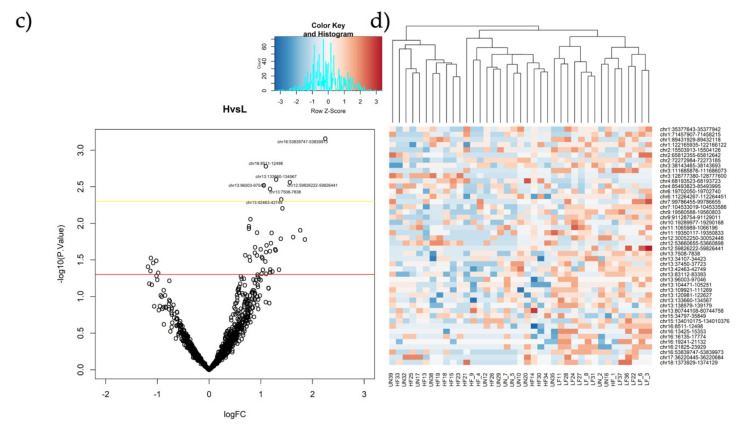
Figure 4.
(a–d) Manhattan (a) and (b), volcano (c) plots, and heat map (d) showing fertility-related DMRs found between HF and LF experimental boar groups. Plots represent −log 10 of p-Values (a) and fold-changes (b); the diamond (b) and heatmap represents only significant DMRs (d), which is also represented by the red threshold (a).


