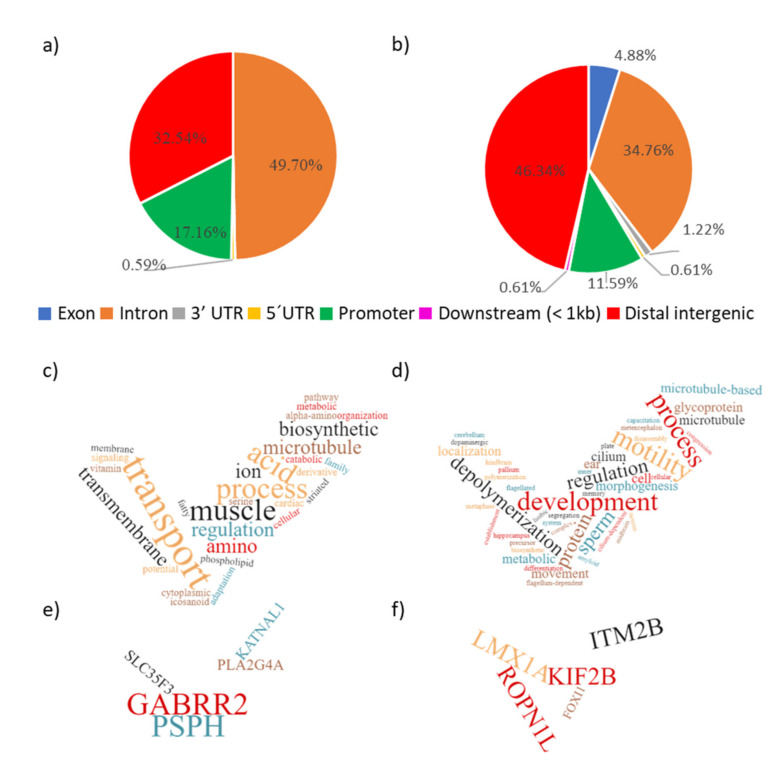
Figure 5.
(a–f). Pie charts representing the functional annotation of the significant (a) SNPs and (b) DMRs, identified between HF and LF experimental boar groups. The work clouds represent the most frequent words that showed up though the significant Gene Ontology (GO)-pathways (adj p ≤ 0.2) of enriched genes related to the significant SNPs (c) and the DMRs (d); while the most frequent genes related with the identified pathways appear in (e) for SNPs and in (f) for DMRs.

