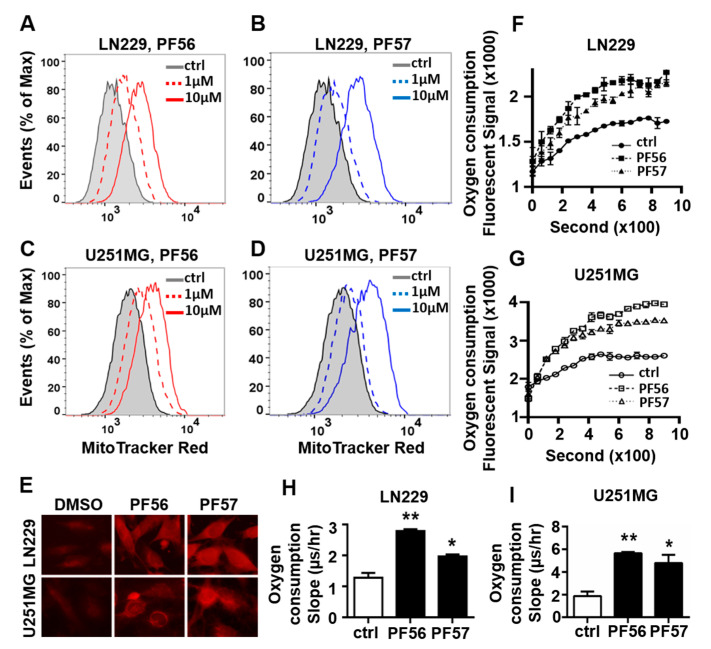
Figure 4.
FAK inhibition increases MitoTracker uptake into mitochondria and oxygen consumption in LN229 and U251MG cells. (A–D) Flow cytometry analysis of MitoTracker stained cells treated with PF573228 (PF57) or PF562271 (PF56) for 16 h at 1 and 10 μM, respectively. (E) Representative immunofluorescent images of the MitoTracker labeled LN229 and U251MG in the presence of PF56 or PF57 (400×). (F,G) Oxygen consumption curve in cells treated with PF56 or PF57 at 10 μM. (H,I) Cellular oxygen consumption rate (slope) calculated based on the oxygen consumption curve in cells treated with 10 μM FAK inhibitors PF56 or PF57. All experiments were repeated at least three times. Data are represented as mean ± SE, * p < 0.05, ** p < 0.01.

