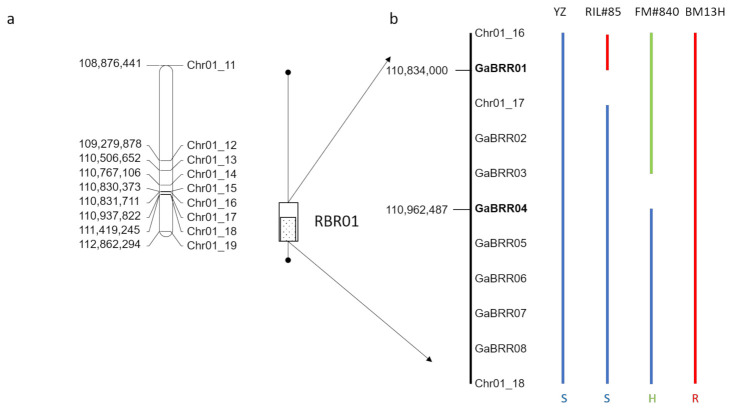
Figure 6.
Mapping of the BRR resistance locus RBR01. (a) Single marker analysis associated resistance with markers Chr01_11 to Chr01_19 (line with closed circles at end), and a single QTL was detected between markers Chr01_17 to Chr01_18 (dotted box). Scoring the phenotype as a simple trait indicated the interval was between Chr01_16 and Chr01_18 (open box). (b) Fine mapping of the region with key recombinants reduced the interval to between GaBRR01 and GaBRR04 markers (bold), S = susceptible (Blue), H = Heterozygous (green) and R- resistant (red).

