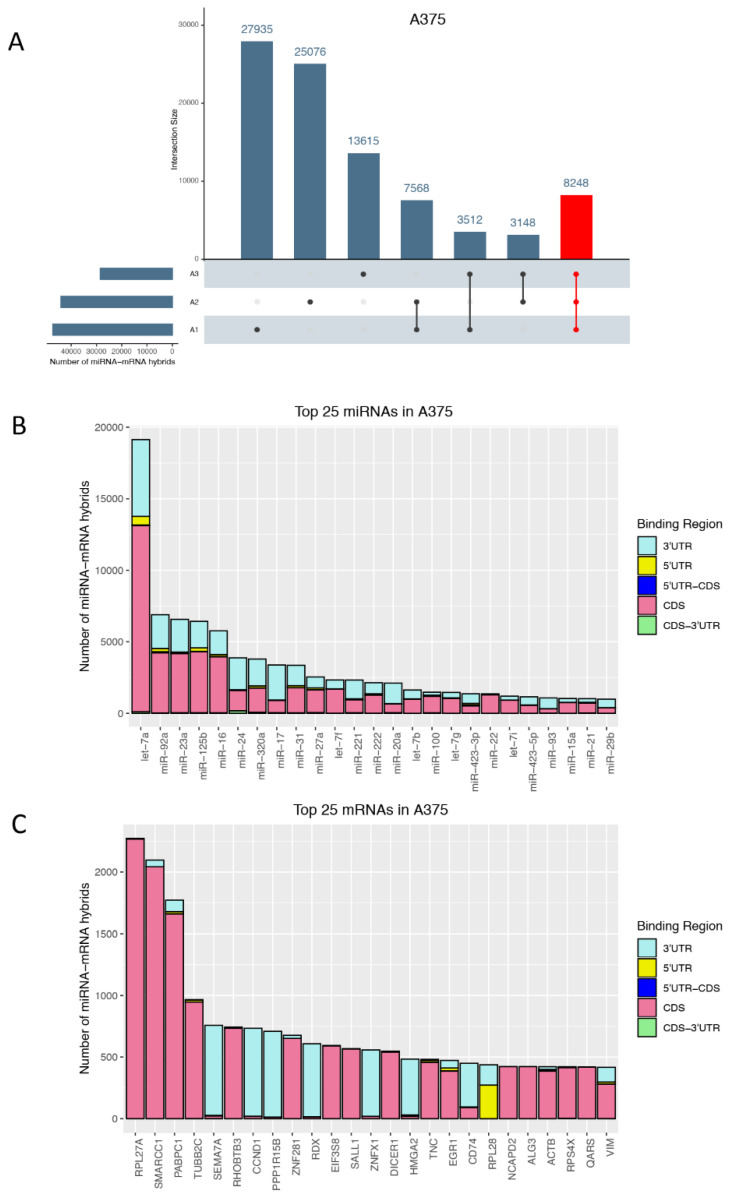
Figure 3.
Most commonly occurring hybrids. (A) UpSet plot representing the number of distinct miRNA-mRNA hybrids across three biological replicates (horizontal bars) that are unique or common across the replicates (vertical bars). miRNA-mRNA hybrids present in all replicates (A1, A2, and A3) of the BRAF-mutant melanoma cell line A375 were highlighted in red. Top 25 (B) miRNAs and (C) mRNAs that occur in miRNA-mRNA hybrids showing the number of hybrids detected and the corresponding binding region on the mRNA. As opposed to the data shown in (A), the number of hybrids in (B,C) was not collapsed for unique miRNA-mRNA pairs; thus, it displays the number of all sequences/hybrids that were identified for that particular miRNA (B) or mRNA (C).

