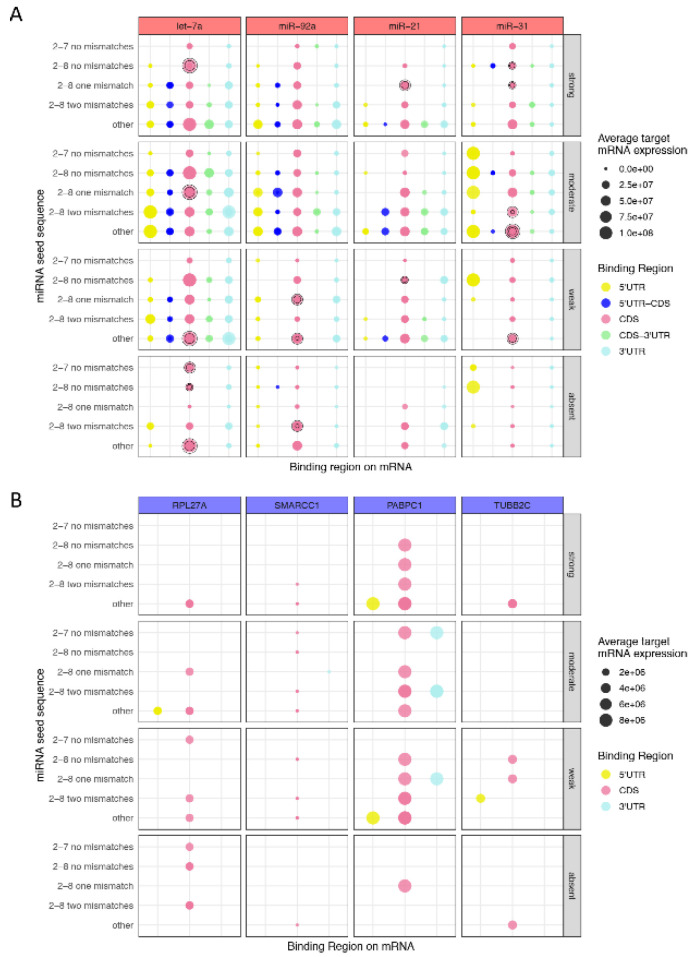
Figure 5.
Comparison of miRNA binding characteristics with target mRNA expression levels. (A) miRNAs frequently occurring in hybrids and with high expression levels (let-7a, miR-92a, miR-21) or low expression levels (miR-31) in TCGA melanoma patient data (TCGA2015) were selected. The size of the circles corresponds to the average expression of a given target mRNA. For each of the four selected miRNAs, several overlapping dots are displayed (highlighted with black circles), as the miRNA can bind to several different targets. (B) Selected mRNAs frequently occurring in hybrids and with high expression levels in melanoma patient data (TCGA2015) (RPL27A, SMARCC1, RAPBC1, and TUBB2C) are shown. The binding characteristics (seed match, supplemental 3′ pairing or strength, and binding region on mRNA) are illustrated as well as the average target mRNA expression levels. The size of the circles represents the average mRNA expression, which remains constant, as the expression of the gene is stable. The exact values, expression levels, and binding characteristics are illustrated in Table S3.

