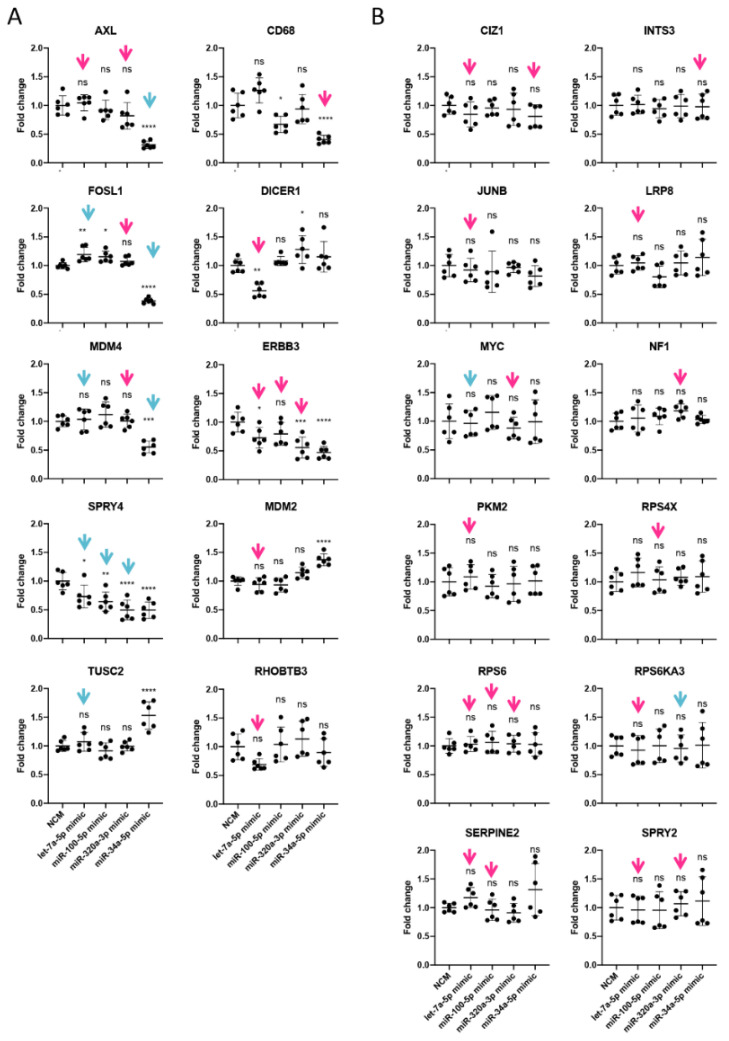
Figure 7.
Expression of selected target mRNAs following transfection with 4 different miRNA mimics. The expression levels were normalized to the corresponding negative control mimic (NCM). Illustrated are 22 genes targeted at the 3′UTR (blue arrows) or CDS (red arrows) whose expression changes (A) or remains unaltered (B) upon 50 nM mimic treatment for 72 h. Statistical significance was determined by one-way ANOVA, followed by Dunnett’s multiple comparisons test with ns, not significant; * p ≤ 0.05; ** p ≤ 0.01; *** p ≤ 0.001; **** p ≤ 0.0001.

