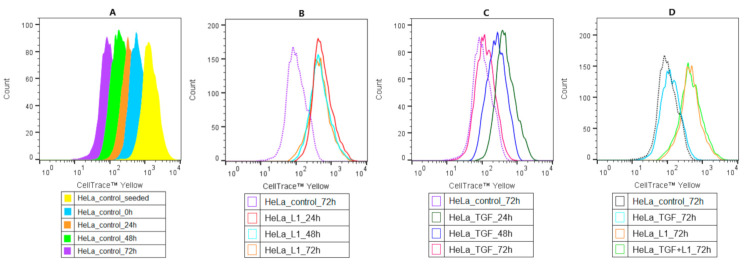
Figure 4.
Flow cytometry analysis of HeLa cell proliferation stained with CellTrace™ Yellow. Control groups proliferation histograms represented by the figure (A), cells treated with L1 (10 µM) (B), cells treated with TGF-β (10 ng/mL) (C), cells treated with L1 or in combination L1/ TGF-β on 72 h (D). Representative histograms of three independent experiments are presented.

