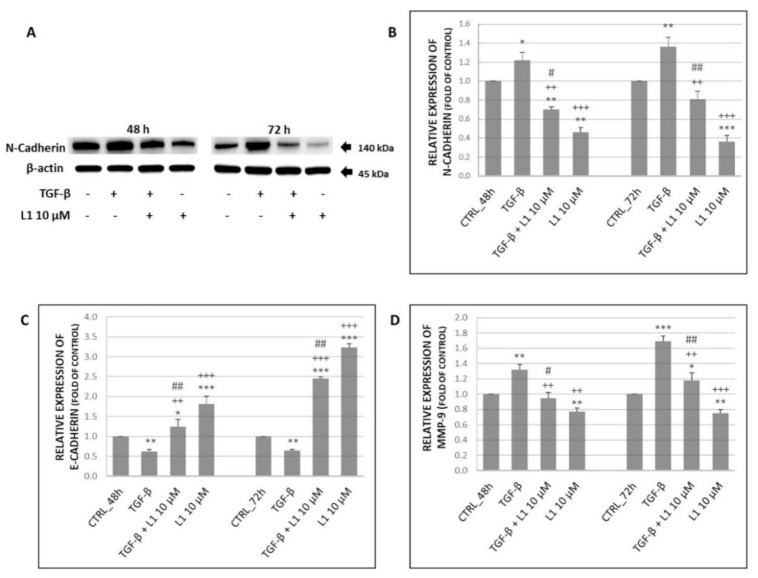
Figure 7.
Changes in expression of N-Cadherin (A) along with its densitometry analyses (B) of western blot results. Relative expression of E-cadherin (C) and MMP-9 (D) obtained by flow cytometry analyses. All after 48 h and 72 h of L1 treatment. Representative data of three independent experiments are presented. Significantly different * p < 0.05, ** p < 0.01, *** p < 0.001 vs. untreated cells (control); ++ p < 0.01, +++ p < 0.001 vs. TGF-β; # p < 0.05, ## p < 0.01 vs. L1.

