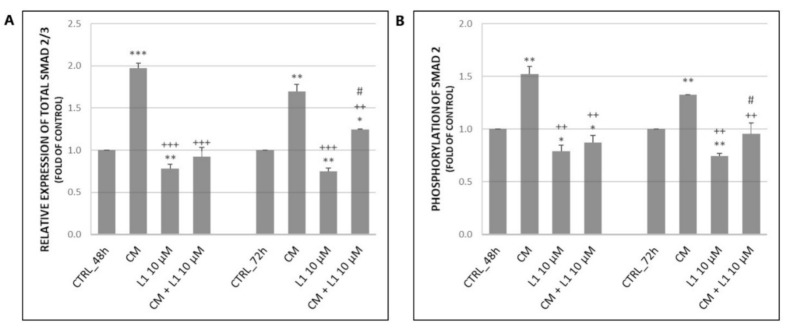
Figure 8.
Changes in expression (A) and phosphorylation (B) of Smad proteins after 48 h and 72 h of CM from BJ-5ta cells and L1 treatment. Representative data obtained by three independent experiments using flow cytometry. CM—conditioned medium. Significantly different * p < 0.05, ** p < 0.01, *** p < 0.001 vs. untreated cells (control); ++ p < 0.01, +++ p < 0.001 vs. CM; # p < 0.05 vs. L1.

