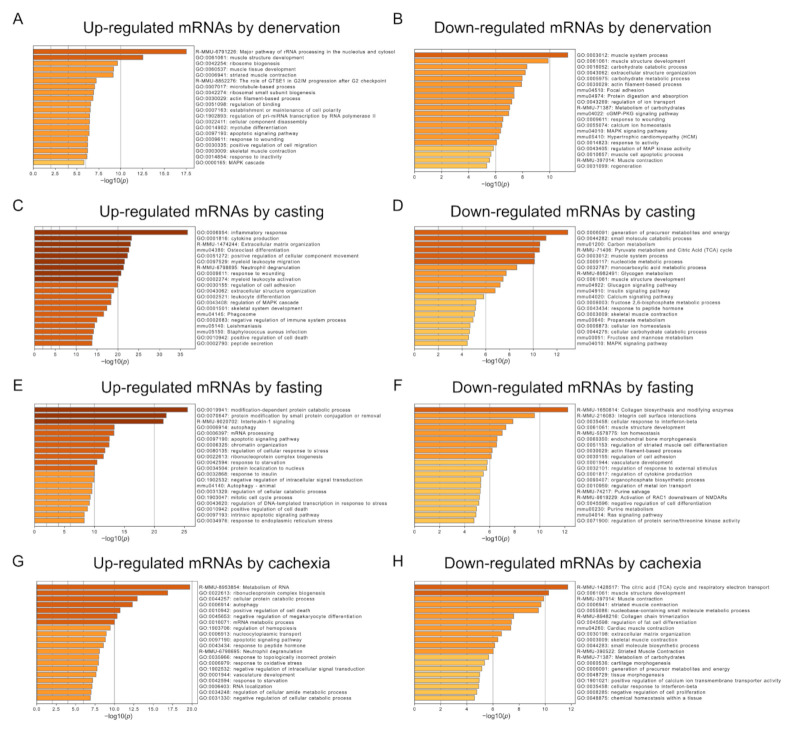
Figure 3.
Functional enrichment analysis of differentially expressed mRNAs in each muscle atrophy condition. Enriched biological processes were ranked by p-value. Bar graphs show the top, non-redundant enrichment clusters (Metascape analysis) for up- or down-regulated mRNAs in response to denervation (A,B), casting (C,D), fasting (E,F), and cancer cachexia treatment (G,H). The x-axis represents the −log10 (p-value).

