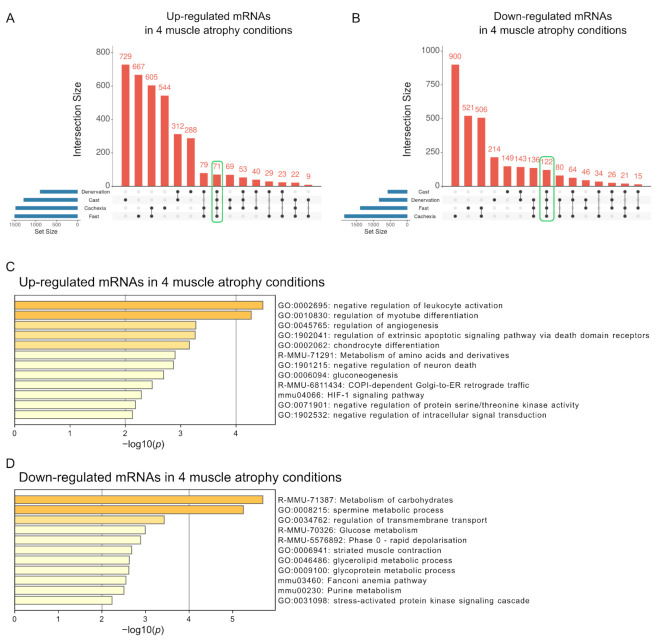
Figure 4.
Functional enrichment analysis of mRNAs with altered expression across all four muscle atrophy conditions. The UpSet plot shows the intersections of up- (A) or down-regulated (B) mRNAs among four muscle atrophy conditions. Each column corresponds to an exclusive intersection containing the elements of the set indicated by the black circles but not the elements of any other set. Set sizes related to blue horizontal bars represent the total number of differentially expressed mRNAs for each condition. The intersection sizes between different muscle atrophy conditions represent exclusive intersections (i.e., intersection sets that are not a subset of other intersection sets). The number of mRNAs whose expression was commonly altered in all four muscle atrophy conditions is encircled by the green line. The results of functional enrichment analyses of up- (C) or down-regulated (D) mRNAs common to the four muscle atrophy conditions are shown by a bar graph generated using Metascape. The x-axis represents the −log10 (p-value).

