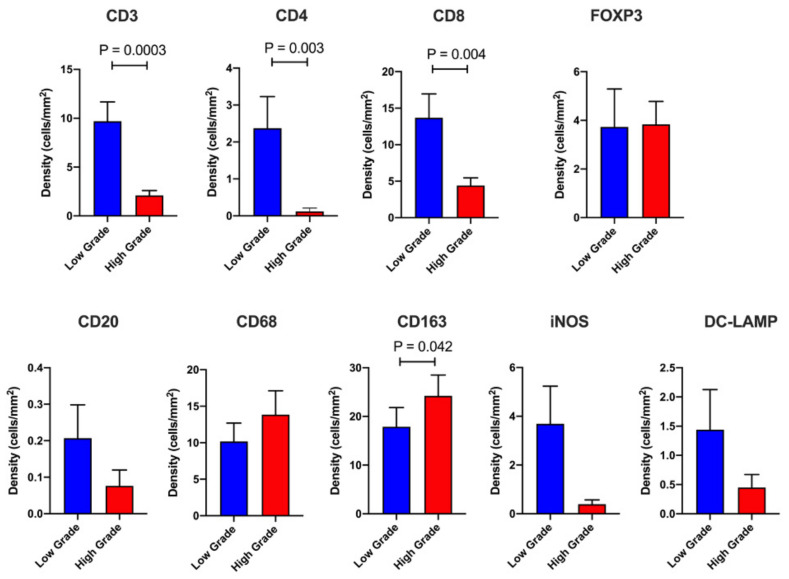
Figure 2.
Intratumoral (IT) immune profiling. Barplots displaying the IT leukocyte density in High Grade (n = 54) versus Low Grade (n = 57) tumor budding cases. The following immune cell markers were utilized (CD3, CD4, CD8, FOXP3, CD20, CD68, iNOS, CD163, DC-LAMP). Data are depicted as mean + standard error (SE). Differences between groups were analyzed using the Mann-Whitney U test. Only significant p-values (<0.05) are shown on the graph.

