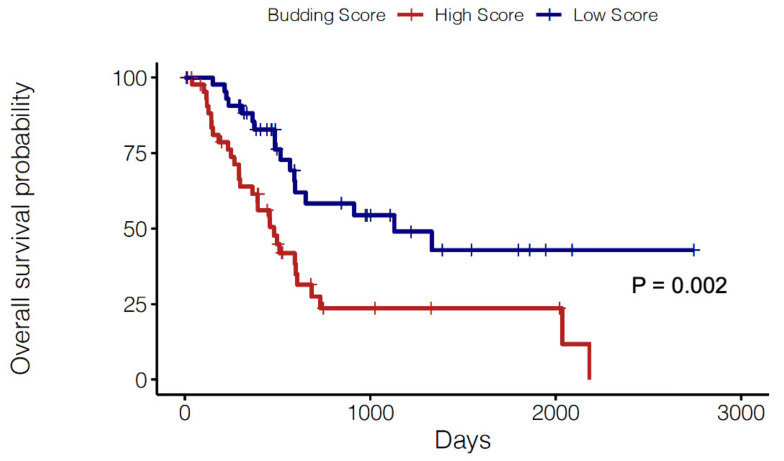
Figure 4.
Prognostic role of tumor budding gene signature. Kaplan-Meier curves comparing the OS of PDAC cases from TCGA with a High (red) vs. Low (blue) Score for the molecular budding signature. Cases were dichotomized as high or low by top and bottom quartiles of expression (n = 45 patients each). Statistical comparisons were performed using the log-rank test. The budding gene score was computed using the singscore package in Bioconductor (see methods).

