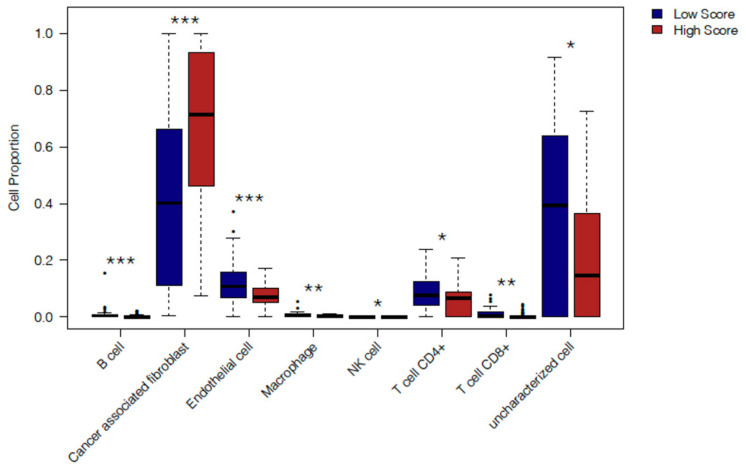
Figure 5.
Cell type deconvolution of TCGA PDAC cases with High and Low Budding gene signature scores. Boxplots comparing the cell fractions as computed by the EPIC algorithm for immune and non-immune cells (B cells, CAFs, Endothelial cells, Macrophages, NK cells, CD4+ T cells, CD8+ T cells and uncharacterized cells) in High vs. Low Budding score cases (n = 45 patients each) from TCGA. Data are shown as box and whisker plots with the box representing the IQR and the whiskers extending to the minimum and maximum values. Statistical comparisons between High and Low Score cases were performed for each immune cell subset individually using the Mann-Whitney U test. Only significant p values (<0.05) are shown on the graph. *** p < 0.001, ** p < 0.01, * p < 0.05.

