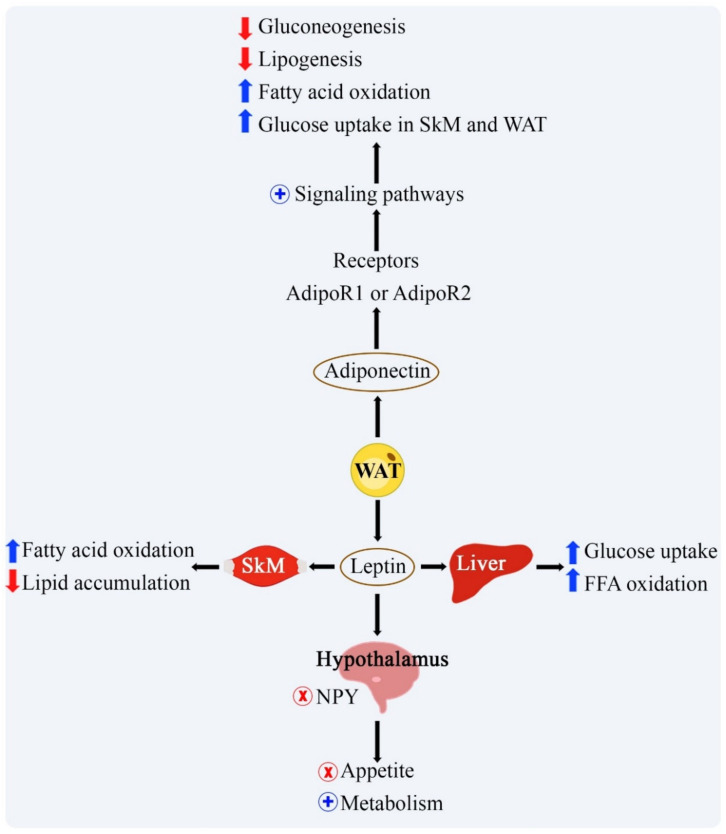
Figure 1.
Effects of leptin and adiponectin on the metabolism of the central nervous system, skeletal muscle, and liver. Black arrows represent the flow in metabolism; blue arrow represents increased action; red arrow represents decreased action; + represents activation; x represents inhibition. FFA: free fatty acid; NPY: neuropeptide Y; SkM: skeletal muscle; WAT: white adipose tissue.

