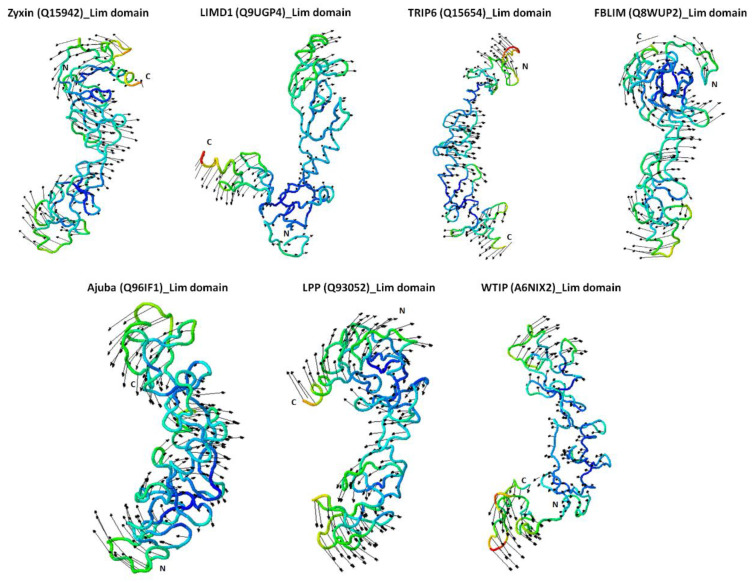
Figure 4.
Normal mode analysis (NMA) of Zyxin family Lim domain proteins. The NMA for each protein model was performed using the iMODS server under default settings. The motion of each domain is indicated by the arrows arising in the direction of motion. Additionally, the models are coloured based on NMA mobility of each structure, where the mobility is represented using a colour spectrum (blue represents the lowest mobility whereas red represents the highest mobility, and intermediate mobility is indicated by interim colours, blue>green>yellow>red). Interestingly, the direction of motion of all proteins is such that the distal ends of the protein move in the direction towards each other producing a motion that resembles clamping.

