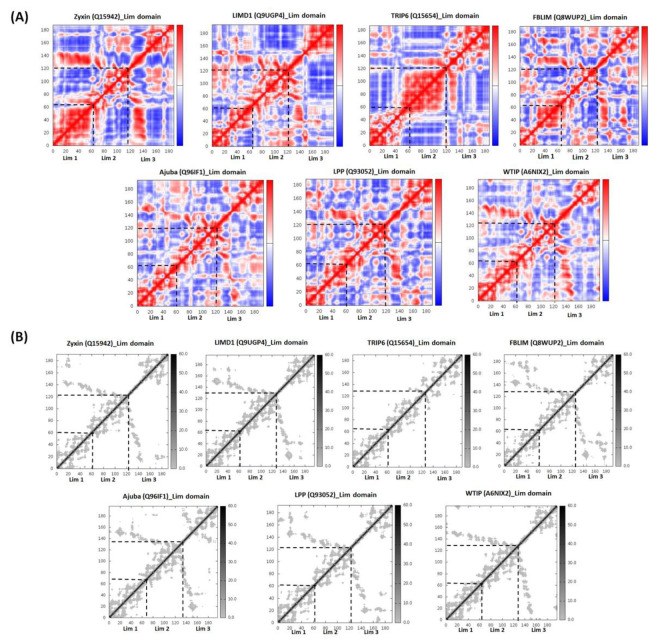
Figure 5.
(A) Covariance analysis of the Zyxin family LIM domains. Covariance analysis was performed to understand the correlated movement of protein residues in the secondary structure which can shed light on the function of the protein. Each panel represents the covariance matrix for each member of the Zyxin family, in the matrix correlated motion is depicted as red, anti-correlated as blue, and uncorrelated as a white dot. High levels of correlated motions were observed in case of Lim1 domains of all protein proteins, varied amount of motion was observed in case of Lim2 with the highest in TRIP6, again Lim3 showed a similar kind of motion in all proteins. Proteins with similar localization and function demonstrated similarity in motion. For example, Ajuba, LIMD1, and WTIP displayed relatively similar covariance matrix of Lim3 domain these proteins are localized at the same site and constitute P-Body components, primarily perform gene regulation and mediate miRNA silencing. LPP and FBLIM1 showed similar correlated, uncorrelated and anticorrelated motions in Lim1/2/3, and both proteins involved mainly in cell shape maintenance; supporting the fact that similar dynamics may have similar localization and functions, each Lim region has its own characteristic features and believed to perform functions independently. (B) The linking matrix of the Elastic network model demonstrates the stiffness of the springs connecting the corresponding pair of atoms. The dots are coloured as a function of their stiffness, darker colours reflect stiffer springs. Interestingly all proteins showed a similar kind of stiffness except TRIP6.

