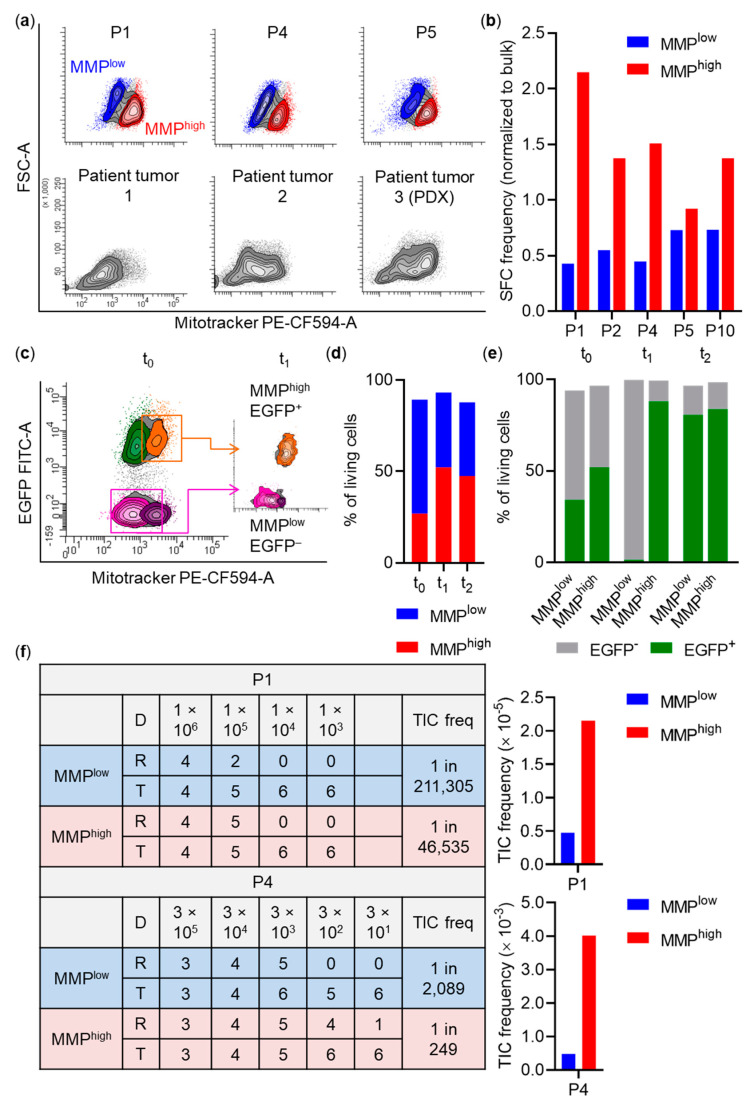
Figure 5.
Association of tumor-initiating cell (TIC) activity and mitochondrial membrane potential (MMP). (a) Top: Heterogeneous MMP staining (Mitotracker) of spheroid cells assessed by flow cytometry (representative plots shown). Colored cell populations indicate sorted fractions. Bottom: Heterogeneous MMP staining pattern in tumor cells. Axis scale numbers are representative for all plots. PDX, patient-derived xenograft. (b) Spheroid-forming cell (SFC) frequencies of MMP sorted spheroid cells (P1, P4: n = 3; P5: n = 2; P2, P10: n = 1) determined by in vitro limiting dilutions. SFC frequencies were calculated based on sphere formation 5–7 days after seeding and normalized to bulk (P1, P4, P5: n = 2; P2, P10: n = 1). (c) Experimental layout of co-cultivation experiments. x- and y-axis are displayed biexponentially. Results for a representative spheroid culture (P1) are shown. Axis scale numbers are representative for all plots. EGFP, enhanced green fluorescent protein. (d,e) Composition of (d) MMPlow and MMPhigh cells or (e) EGFP– and EGFP+ cells in the MMPlow and MMPhigh subpopulations over time. t0: before, t1: directly after, t2: 21 days after sort. (f) Results of limiting dilutions in vivo. Left: Overview of dose (D) and response (R). Right: TIC frequencies of MMP sorted spheroid cells. TIC frequencies were calculated based on tumor formation seven weeks (P1: n = 42 mice) or five weeks (P4: n = 48 mice) after transplantation. Freq, frequency; T, tested.

