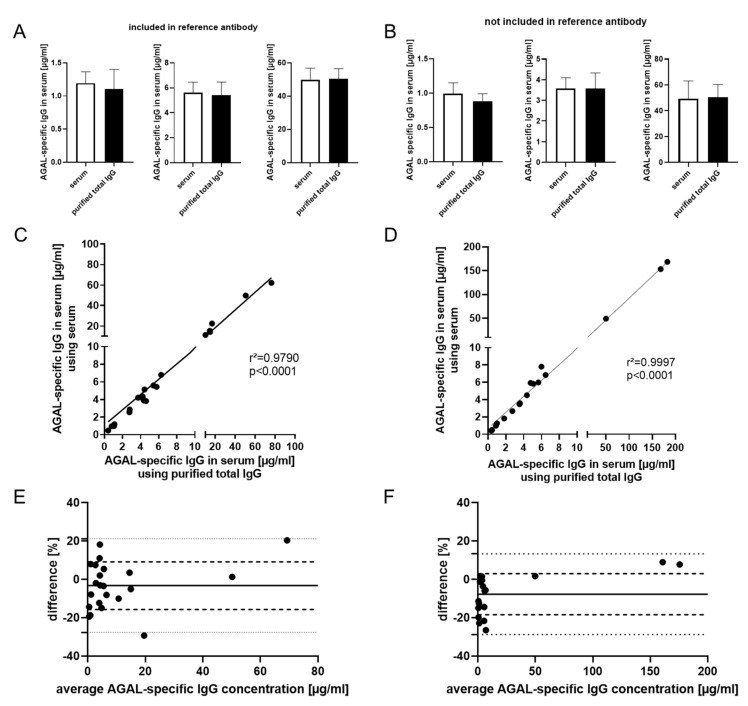
Figure A2.
ELISA-based determination of anti-AGAL antibody concentrations. Representative ELISA-based measures using sera and purified total IgGs from patients’ samples (three each), while samples in (A) are included and (B) are not included in the anti-AGAL reference antibody. The high correlations of anti-AGAL antibody concentration between patients’ sera and their corresponding purified total IgGs in (C) reference antibody included (N = 22), respectively, in (D) reference antibody not included (N = 18) patients were supported by Bland-Altman plot with (E) bias: −3.179% (solid line), SD: −15.619% and 9.261% (dashed lines), 95% limits of agreement: −27.56% and 21.2% (dotted lines) and (F) bias: −7.68% (solid line), SD: −18.4% and 3.04% (dashed lines), 95% limits of agreement: −28.7% and 13.34% (dotted lines) AGAL: α-galactosidase A; IgG: Immunoglobulin G.

