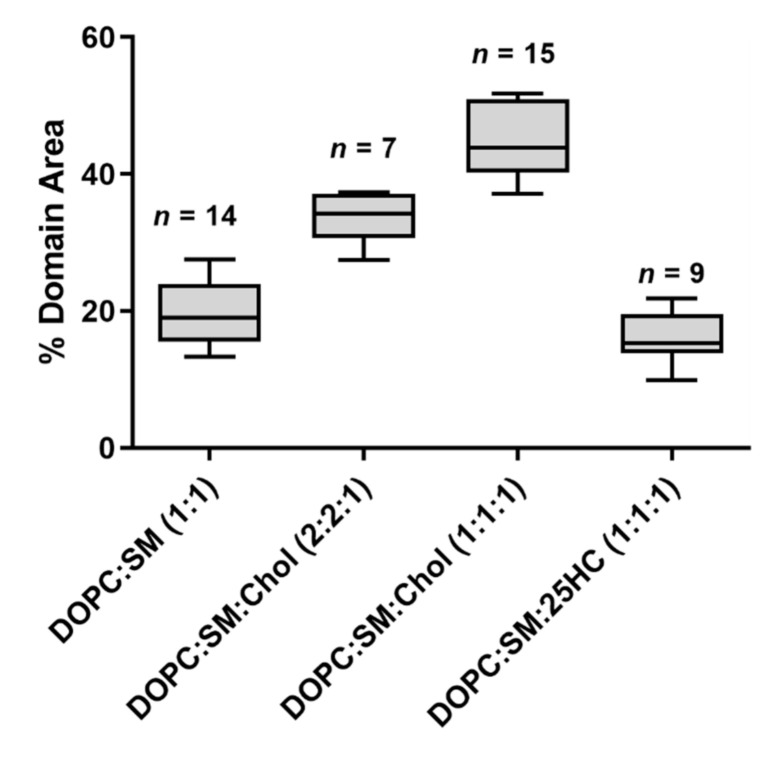
Figure 2.
The fraction of the immiscible phase separation area occupancy in the whole SLB, calculated from imaging analysis. Each domain area was calculated from images of 30 × 30 µm2. Sample sizes are given above the boxes. All samples passed a normality test. Statistically significant variations were seen for all multiple comparisons of the percentage of domain area (one-way ANOVA and Tukey’s post hoc test, with p < 0.05), except for the variation in percentage of domain area between SLBs of DOPC:SM (1:1) and DOPC:SM:25HC (1:1:1), which is not statistically significant (p > 0.05).

