Figure 1.
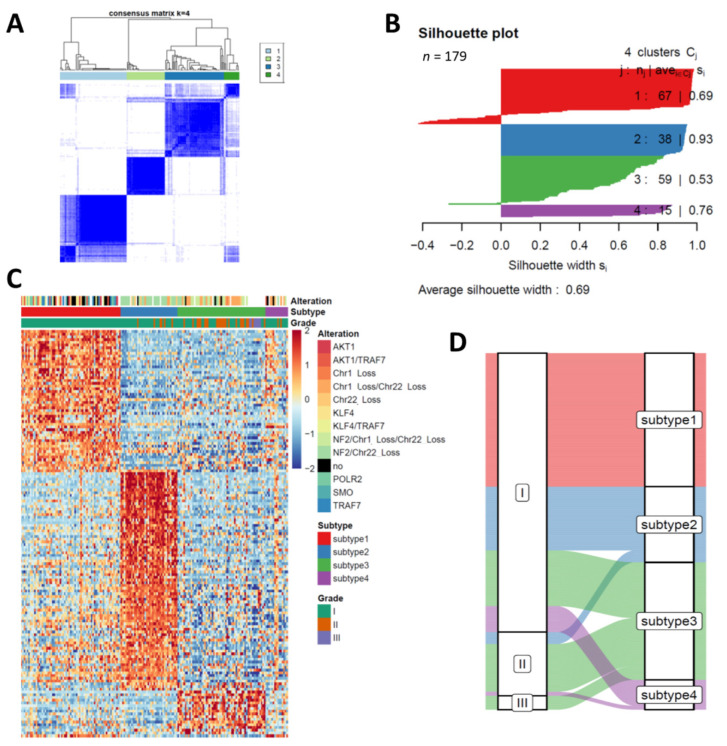
Consensus clustering of 179 meningiomas on gene expression. (A) Consensus matrix plot display consensus (k = 4) is the best number for subgrouping. (B) Clustering significance of each subtype is indicated by silhouette plot. (C) Heatmaps of the upregulated genes in each subtype highlights the heterogeneity of meningioma. Somatic mutation and copy number alteration of each sample is labelled in the top. no, no alteration is detected in given sample. (D) Sankey plot displays the change of classification of each sample from WHO grade to transcriptome subtypes.

