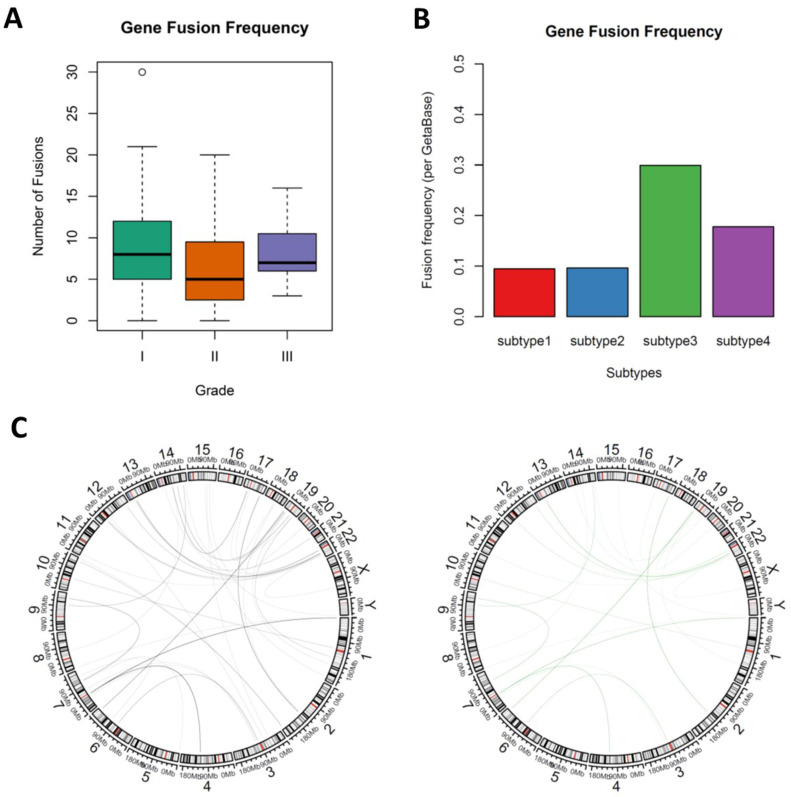
Figure 3.
The landscape of fusion genes in meningiomas. (A) Gene fusion frequency between WHO grades; right, ANOVA test, p = 0.115. (B) Bar plot showing the interchromosomal gene fusion frequency of each subtypes. (C) Circus plots showing the interchromosomal gene fusion in all meningioma (left) and subtype 3 meningioma (right).

