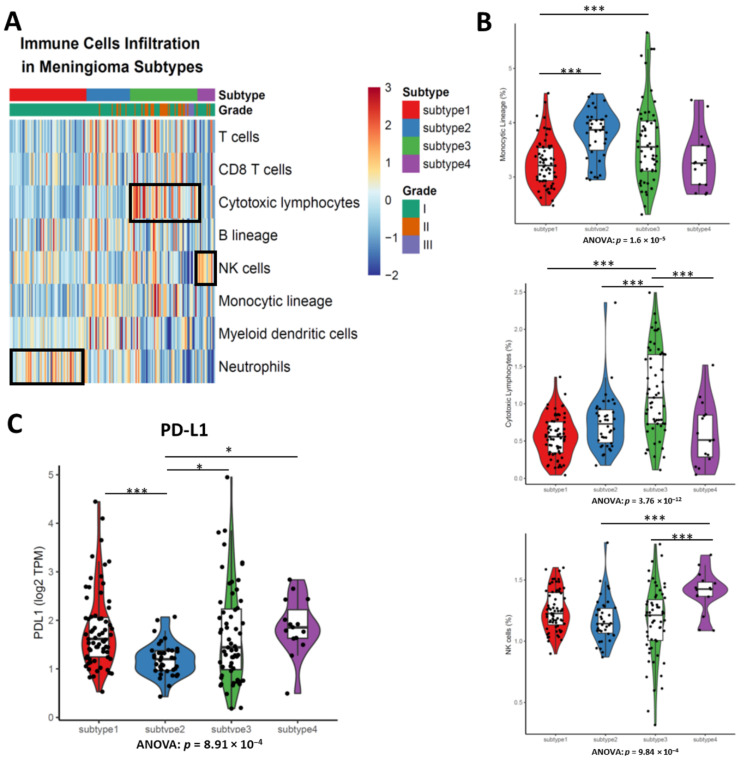
Figure 4.
The levels of immune cell infiltration inferred by MCPcounter are distinct between subtypes of meningiomas. (A) Heatmap of immune cells infiltration highlights the enriched gene expression signature of distinct immune cells infiltration pattern between subtypes of meningiomas. Cytotoxic lymphocytes are enriched in subtype 3. Natural killer (NK) cells are enriched in subtype 4. Neutrophils are enriched in subtype 1. (B) Meningioma of subtype 3 has higher cytotoxic lymphocytes infiltration than others. Violin plots shows the immune cells infiltration between subtypes. (C) Subtypes have different PD-L1 expressions. ANOVA test, more than three groups comparison. Tukey’s HSD post hoc test. * p < 0.05; *** p < 0.001.

