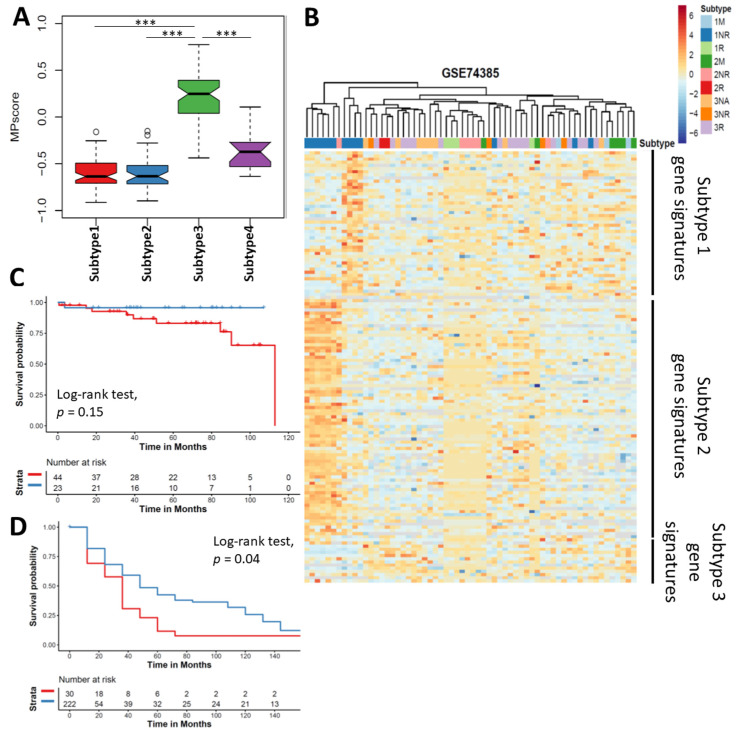
Figure 6.
Validation of meningioma progression score. (A) Boxplot showing the MPscore in Subtype 3 was significantly higher than other subtypes. (B) Heatmap showing our clustering is also observed in validation cohort. Kaplan-Meier Curves showing the overall survival (C) and recurrent free survival (D) stratified by MPscore. Log-rank test was performed to examine the statistical difference. Red, high MPscore; blue, low MPscore. *** p < 0.001.

