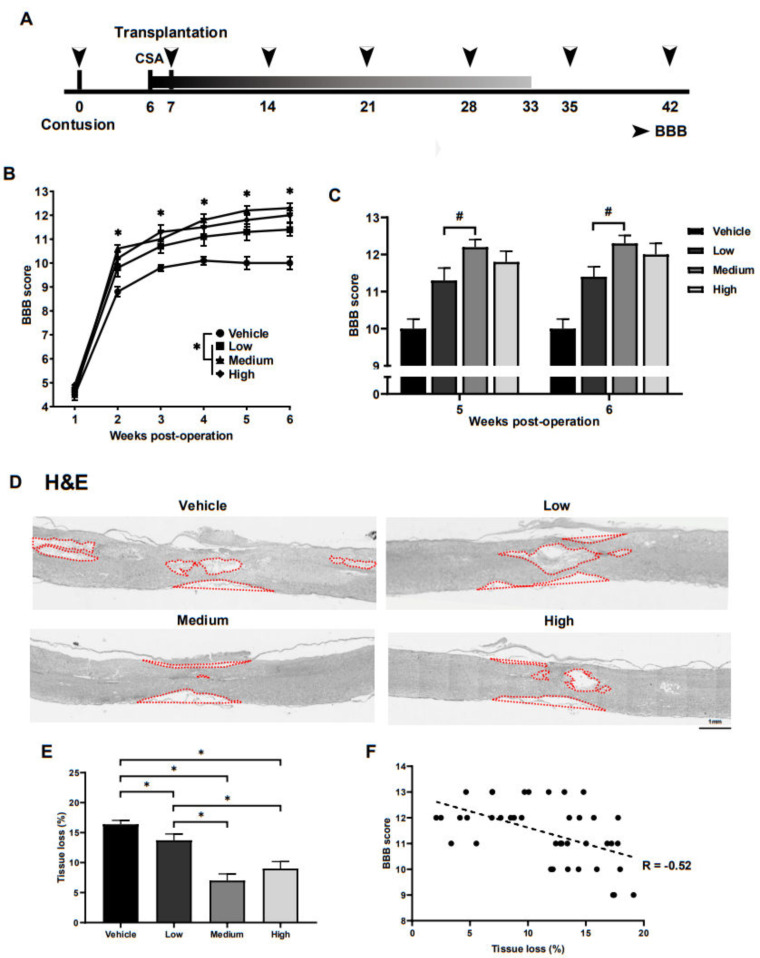
Figure 2.
Preclinical therapeutic effects of ahMNCs in SCI. (A) Schematic describing the experimental timeline. (B) BBB scores were monitored once a week until 6 weeks post SCI. (C) The BBB scores at 5 and 6 weeks after SCI were compared. (D) Tissue loss was evaluated using histological methods at 6 weeks post SCI. Red lines delineate the contours of the lost tissue including both cavities and shrunken tissue. Scale bar = 1 mm. (E) Relative areas of tissue loss were quantified and then compared. (F) Correlation analysis revealed a significant negative relationship between the degree of tissue loss and the BBB score. Height = Average, Error bar = Standard Error. *, # P < 0.05.

