Figure 2.
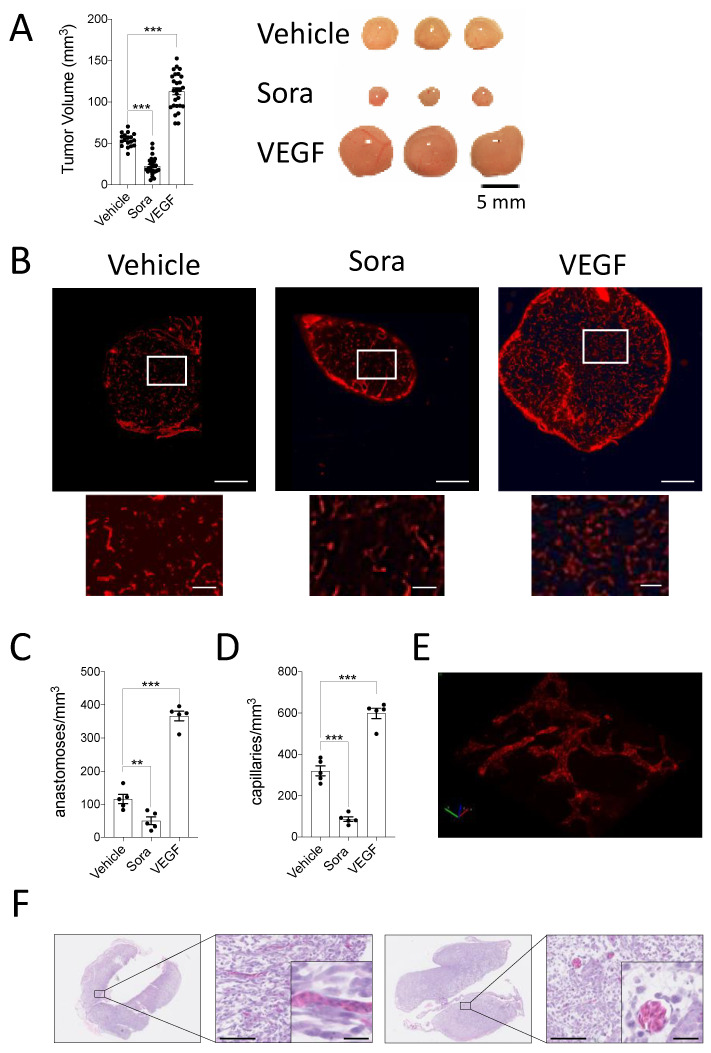
(A–D) HT-1080 cell suspensions were inoculated onto the CAM in the presence or absence of VEGF while Sorafenib (Sora) or DMSO (Vehicle) were added topically to the developing tumors every day. (A) Tumor volumes were calculated after 7 days of growth and representative images of tumors are shown (n = 18–27). (B–D) LCA was injected into CAM vasculature prior to tumor extraction. (B) Representative immunofluorescence images and corresponding zooms showing vascularization in the control and treated tumor xenografts (LCA; red). Scale bar = 500 μm. Zoomed area is outlined in white, scale bar =100 μm. (C,D) Quantification of the number of anastomoses (C), and capillaries (D) per mm3 are shown (n = 5). (E,F) 3D reconstruction of the CAM vasculature using Imaris Software (E (Video S1)) and representative H&E staining of HT1080 tumor xenografts cultivated on the CAM for 7 days (F). Higher magnification shows the presence of chicken nucleated erythrocytes. Scale bars, 100 μm. Inset scale bars, 25 μm. Bars represent the mean ± SEM. The asterisks (*) correspond to p < 0.01 (**), and p < 0.001 (***), one-way Anova.

