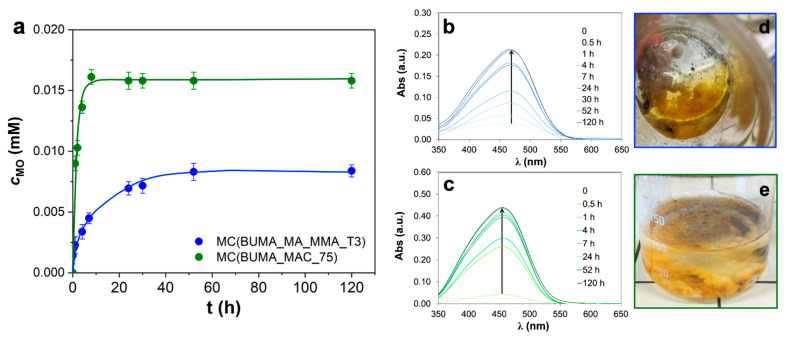
Figure 4.
(a) Released MO concentration curves relative to MC(BUMA_MA_MMA_T3) and MC(BUMA_MAC_75) systems. Error bars computed on three different replicates. (b,c) Corresponding kinetics followed through ultraviolet/visible (UV/Vis) analysis, along with the relative (d,e) photos taken at the end of the test (120 h).

