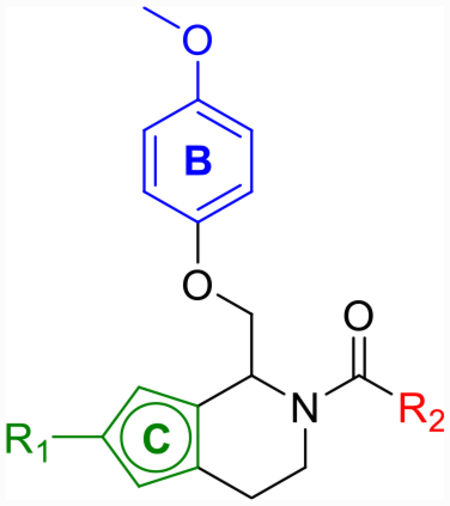
Table 4.
Optimization of A- and C-Ring Functionality for Thiophene Corec
| # | R1 | C-ring | R2 | pEC50 [95% CI] (max) (%)a | p(doubling conc.) (GluN2C/2D)b | sol. (μM) | cLogP | LLE (GluN2C/2D) | |
|---|---|---|---|---|---|---|---|---|---|
| GluN2C | GluN2D | ||||||||
| CIQc (TIQ core) |  |
5.3 (230) | 5.3 (220) | 4.9/4.5 | 8 | 5.6 | −0.7/−1.1 | ||
| 25a | H | 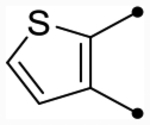 |
 |
5.4 [5.3–5.5] (280) | 5.4 [5.3–5.5] (350) | 5.3/S.6 | 46 | 5.6 | −0.3/0.0 |
| 25h | H | 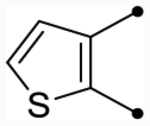 |
 |
5.4 [5.3–5.4] (330) | 5.3 [5.2–5.3] (340) | 5.5/5.4 | - | 5.6 | −0.1/−0.2 |
| 25b | H | 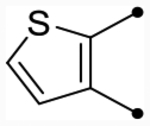 |
 |
5.3 [5.3–5.3] (290) | 5.3 [5.2–5.4] (400) | 5.3/5.6 | - | 5.4 | −0.1/0.2 |
| 25c | H | 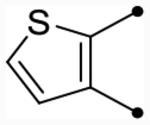 |
 |
4.9 [4.8–5.0] (290) | 4.8 [4.6–4.9] (330) | 4.8/4.9 | - | 3.6 | 1.2/1.3 |
| 25d | OMe | 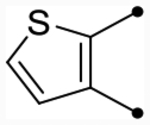 |
 |
5.3 [5.2–5.4] (220) | 5.2 [5.1–5.2] (220) | 4.6/4.5 | - | 5.7 | −1.1/−1.2 |
Fitted pEC50 values are shown to have two significant figures when potentiation at 30 μM exceeded 130% of control; values in brackets are the 95% confidence interval for the corresponding log-fitted pEC50 value; and values in parentheses are the fitted maximum response as a percentage of the initial glutamate (100 μM) and glycine (30 μM) current. Data are between 10 and 12 oocytes from 2 frogs for each compound and receptor.
p(doubling conc.) is the negative log of the doubling concentration.
Previously published data for CIQ were included for comparison.

