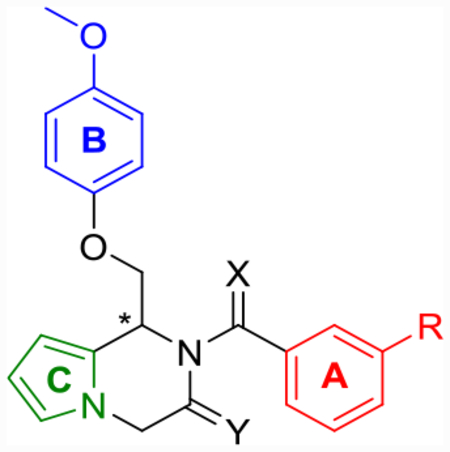
Table 7.
Stereodependence of Select Pyrrolopyrazine Corese
 |
|||||||||
|---|---|---|---|---|---|---|---|---|---|
| pEC50 [95% CI] (max) (%)a | |||||||||
| # | X | Y | R | GluN2C | GluN2D | p(doubling conc.) (GluN2C/2D)b | sol. (μM)c | cLogP | LLE (GluN2C/2D) |
| CIQd (TIQ core) | Cl | 5.3 (230) | 5.3 (220) | 4.9/4.5 | 8 | 5.6 | −0.7/−1.1 | ||
| S-(−)-31a | O | CF3 | ND (84) | ND (88) | 57 | 5.2 | |||
| R-(+)-31a | O | CF3 | 6.1 [6.0–6.3] (280) | 6.1 [6.0–6.2] (330) | 6.0/6.2 | 57 | 5.2 | 0.8/1.0 | |
| S-(−)-25i | O | Cl | ND (98) | ND (99) | 36 | 4.9 | |||
| R-(+)-25i | O | Cl | 5.7 [5.7–5.8] (410) | 5.7 [5.7–5.8] (450) | 6.1/6.2 | 36 | 4.9 | 1.2/1.3 | |
| S-(−)-25j | O | CF3 | ND (99) | ND (98) | 58 | 5.1 | |||
| R-(+)-25j | O | CF3 | 5.9 [5.8–6.0] (460) | 5.9 [5.8–5.9] (540) | 6.3/6.4 | 58 | 5.1 | 1.2/1.3 | |
| S-(−)-EU-1180-453 | O | F | ND (100) | ND (88) | 74 | 4.5 | |||
| R-(+)-EU-1180-453 | O | F | 5.5 [5.4–5.6] (410) | 5.5 [5.4–5.6] (390) | 5.9/5.8 | 74 | 4.5 | 1.4/1.3 | |
Fitted pEC50 values are shown to have two significant figures when potentiation at 30 μM exceeded 130% of control; values in brackets are the 95% confidence interval for the corresponding log-fitted pEC50 value; and values in parentheses are the fitted maximum response as a percentage of the initial glutamate (100 μM) and glycine (30 μM) current. For compounds in which a pEC50 value was not determined, maximum potentiation is reported as percent potentiation at 30 μM drug. Data are between 6 and 13 oocytes from 2 frogs for each compound and receptor.
p(doubling conc.) is the negative log of the doubling concentration.
Aqueous solubilities reported from racemic mixtures.
Previously published data for CIQ were included for comparison.
ND = not determined.
