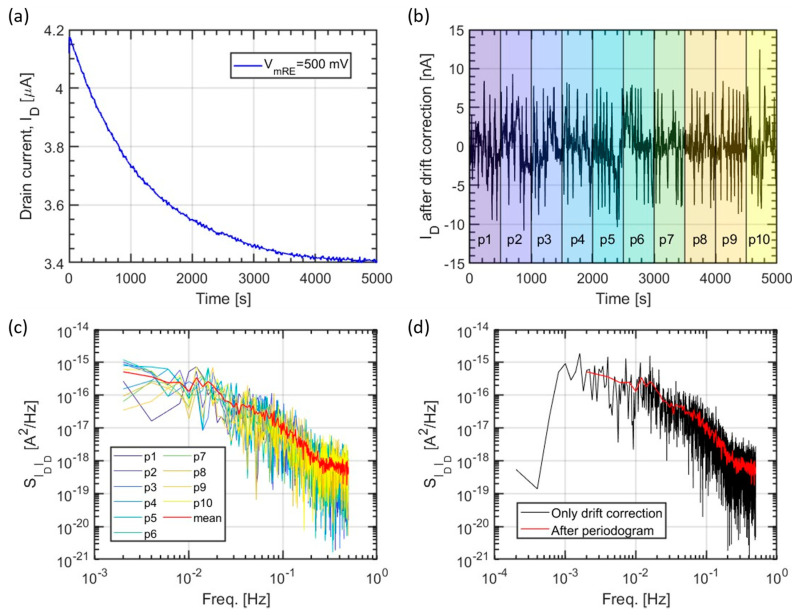
Figure 5.
Example of post-processing a drain current waveform measured with sampling time s and mV. (a) The measured raw waveform of the drain current vs. time. (b) The same waveform after drift removal using a 10th order polynomial function and subdivision in ten portions (colored areas) for the application of the periodogram technique. (c) Power spectral density (PSD) of each portion of the drift-corrected drain current waveform in (b) with a red line showing the average between all the PSDs, i.e., the periodogram. (d) Comparison of the PSDs with data cleaned with only the drift correction and data cleaned with both drift correction and periodogram.

